AppSec
Scan sensors
The Sensors tab is where you deploy, monitor, and manage the sensors that reach into your network to run assessments. This is different from the Agents tab (Docker-based scan agents used inside individual assessments); sensors are the underlying fleet of installed connectors, with their own enrollment, health monitoring, and security keys.
What it's for
- Deploy a sensor: pick a sensor type, generate a one-time enrollment token, and download the installer for your platform.
- Monitor fleet health: see which sensors are connected, how they're performing, and when they last checked in.
- Manage sensor security: rotate a sensor's connection certificate or access key if you suspect it's been compromised, or need to reconnect it.
The screens in it
When you open Sensors, you land on a single page with a fleet summary at the top, a deploy flow, a downloads section, the list of connected sensors, and enrollment tokens.
Every control explained
Fleet summary
Next to the page title, a small stats strip shows Total, Active, Stale, and Offline sensor counts across your fleet.
Deploying a new sensor
| Control | What it does |
|---|---|
| 1. Choose sensor type | A set of cards, one per sensor type available on your subscription. Each shows what it's capable of (for example, network scanning or AppSec proxying). The suggested option is marked Recommended. Types your subscription doesn't include are shown grayed out with the reason, so you know what upgrading would unlock. |
| 2. Generate enrollment token | Name the token (for example, "East region sensor") and click Generate enrollment token. |
Once generated, the token is shown once; copy it now, because the page won't show it again. Alongside the token, you get ready-to-run install commands for Docker, Linux, and Windows, each with its own Copy button. Click Create another token to enroll a second sensor.
If you didn't copy it in time, revoke it from Enrollment Tokens below and generate a new one; the platform can't show a token's value again.
Scan Sensor Downloads
A separate card lists the installer for each supported platform: Docker, Linux, Windows, and macOS.
| Control | What it does |
|---|---|
| Download / Docker reference | Downloads the installer for that platform, or (for Docker) links to Docker's own run-command reference. |
| Copy command | Copies the install command shown below the card. |
| SHA-256 verified / Verification pending badge | Shows whether the download has a published checksum you can verify it against. |
Connected Sensors
The main table lists every sensor that has ever enrolled.
| Column | What it shows |
|---|---|
| Status | A colored dot: Active, Stale, Quarantined, Offline, or Decommissioned. |
| Name | The sensor's display name. Hover and click the pencil icon to rename it inline. |
| IP / Host | The sensor's network address and hostname. |
| Heartbeat | How long since the sensor last checked in, color-coded (green if recent, red if it's been a while, or "Never"). |
| Health | Small usage bars for CPU, Memory, and Disk, when the sensor reports them. |
| Latency | The result of the last connectivity check, or a dash until you run one. |
| Capabilities | Badges for what the sensor can do; click +N to see the rest. |
| Version | The sensor software version currently installed. |
Row actions (hover a row to reveal them):
| Action | What it does |
|---|---|
| Check connectivity (signal) | Pings the sensor and shows whether it's reachable, and how fast. |
| View details & logs (eye) | Opens the sensor's detail panel (below). |
| Open sensor console (file) | Opens the sensor's own local console in a new browser tab. |
| Decommission (trash) | Disconnects the sensor and removes it from the active fleet, after a confirmation that also gives you the command to remove it from the host machine. |
| Permanently delete (trash, decommissioned sensors only) | Deletes all historical data for the sensor, after a confirmation. |
A sensor's detail panel
Click View details & logs on any row to expand its full detail below the table:
- Metadata: agent ID, OS family, version, network zone (if set), total scans run, findings reported, last heartbeat, last scan, and when it was registered.
- mTLS status: whether the sensor's connection certificate is verified, when it was last rotated, and a Rotate mTLS Key button (with a confirmation, since the sensor briefly disconnects and reconnects while it picks up the new certificate).
- Sensor Access Key: masked by default; use the eye icon to reveal it, the copy icon to copy it, or Regenerate to issue a new one (with a confirmation; the old key stops working immediately). This key is what you use to sign into the sensor's own local console.
- Resource Usage: more detailed CPU, Memory, and Disk usage bars.
- Quick Reachability Test: enter a URL or IP and press Test to have the sensor itself attempt to reach it, useful for confirming what a sensor can and can't see inside your network.
- Recent Activity: a timeline of registration, scans, heartbeats, errors, and status changes for that sensor.
Enrollment Tokens
A collapsed section listing every token you've generated.
| Control | What it does |
|---|---|
| Status badge | Active, Expired, Revoked, or Exhausted (used up its allowed uses). |
| Revoke (active tokens) | Invalidates the token immediately, with a confirmation. |
| Delete (revoked, expired, or exhausted tokens) | Removes the token from the list entirely, with a confirmation. |
Each row also shows when the token was created, when it expires (or "No expiry"), and how many times it's been used.
Common workflows
Workflow: enroll a new sensor
- On the Sensors tab, pick a sensor type under 1. Choose sensor type.
- Name your sensor under 2. Generate enrollment token and click Generate enrollment token.
- Copy the token value and the install command for your platform; the token is only shown this once.
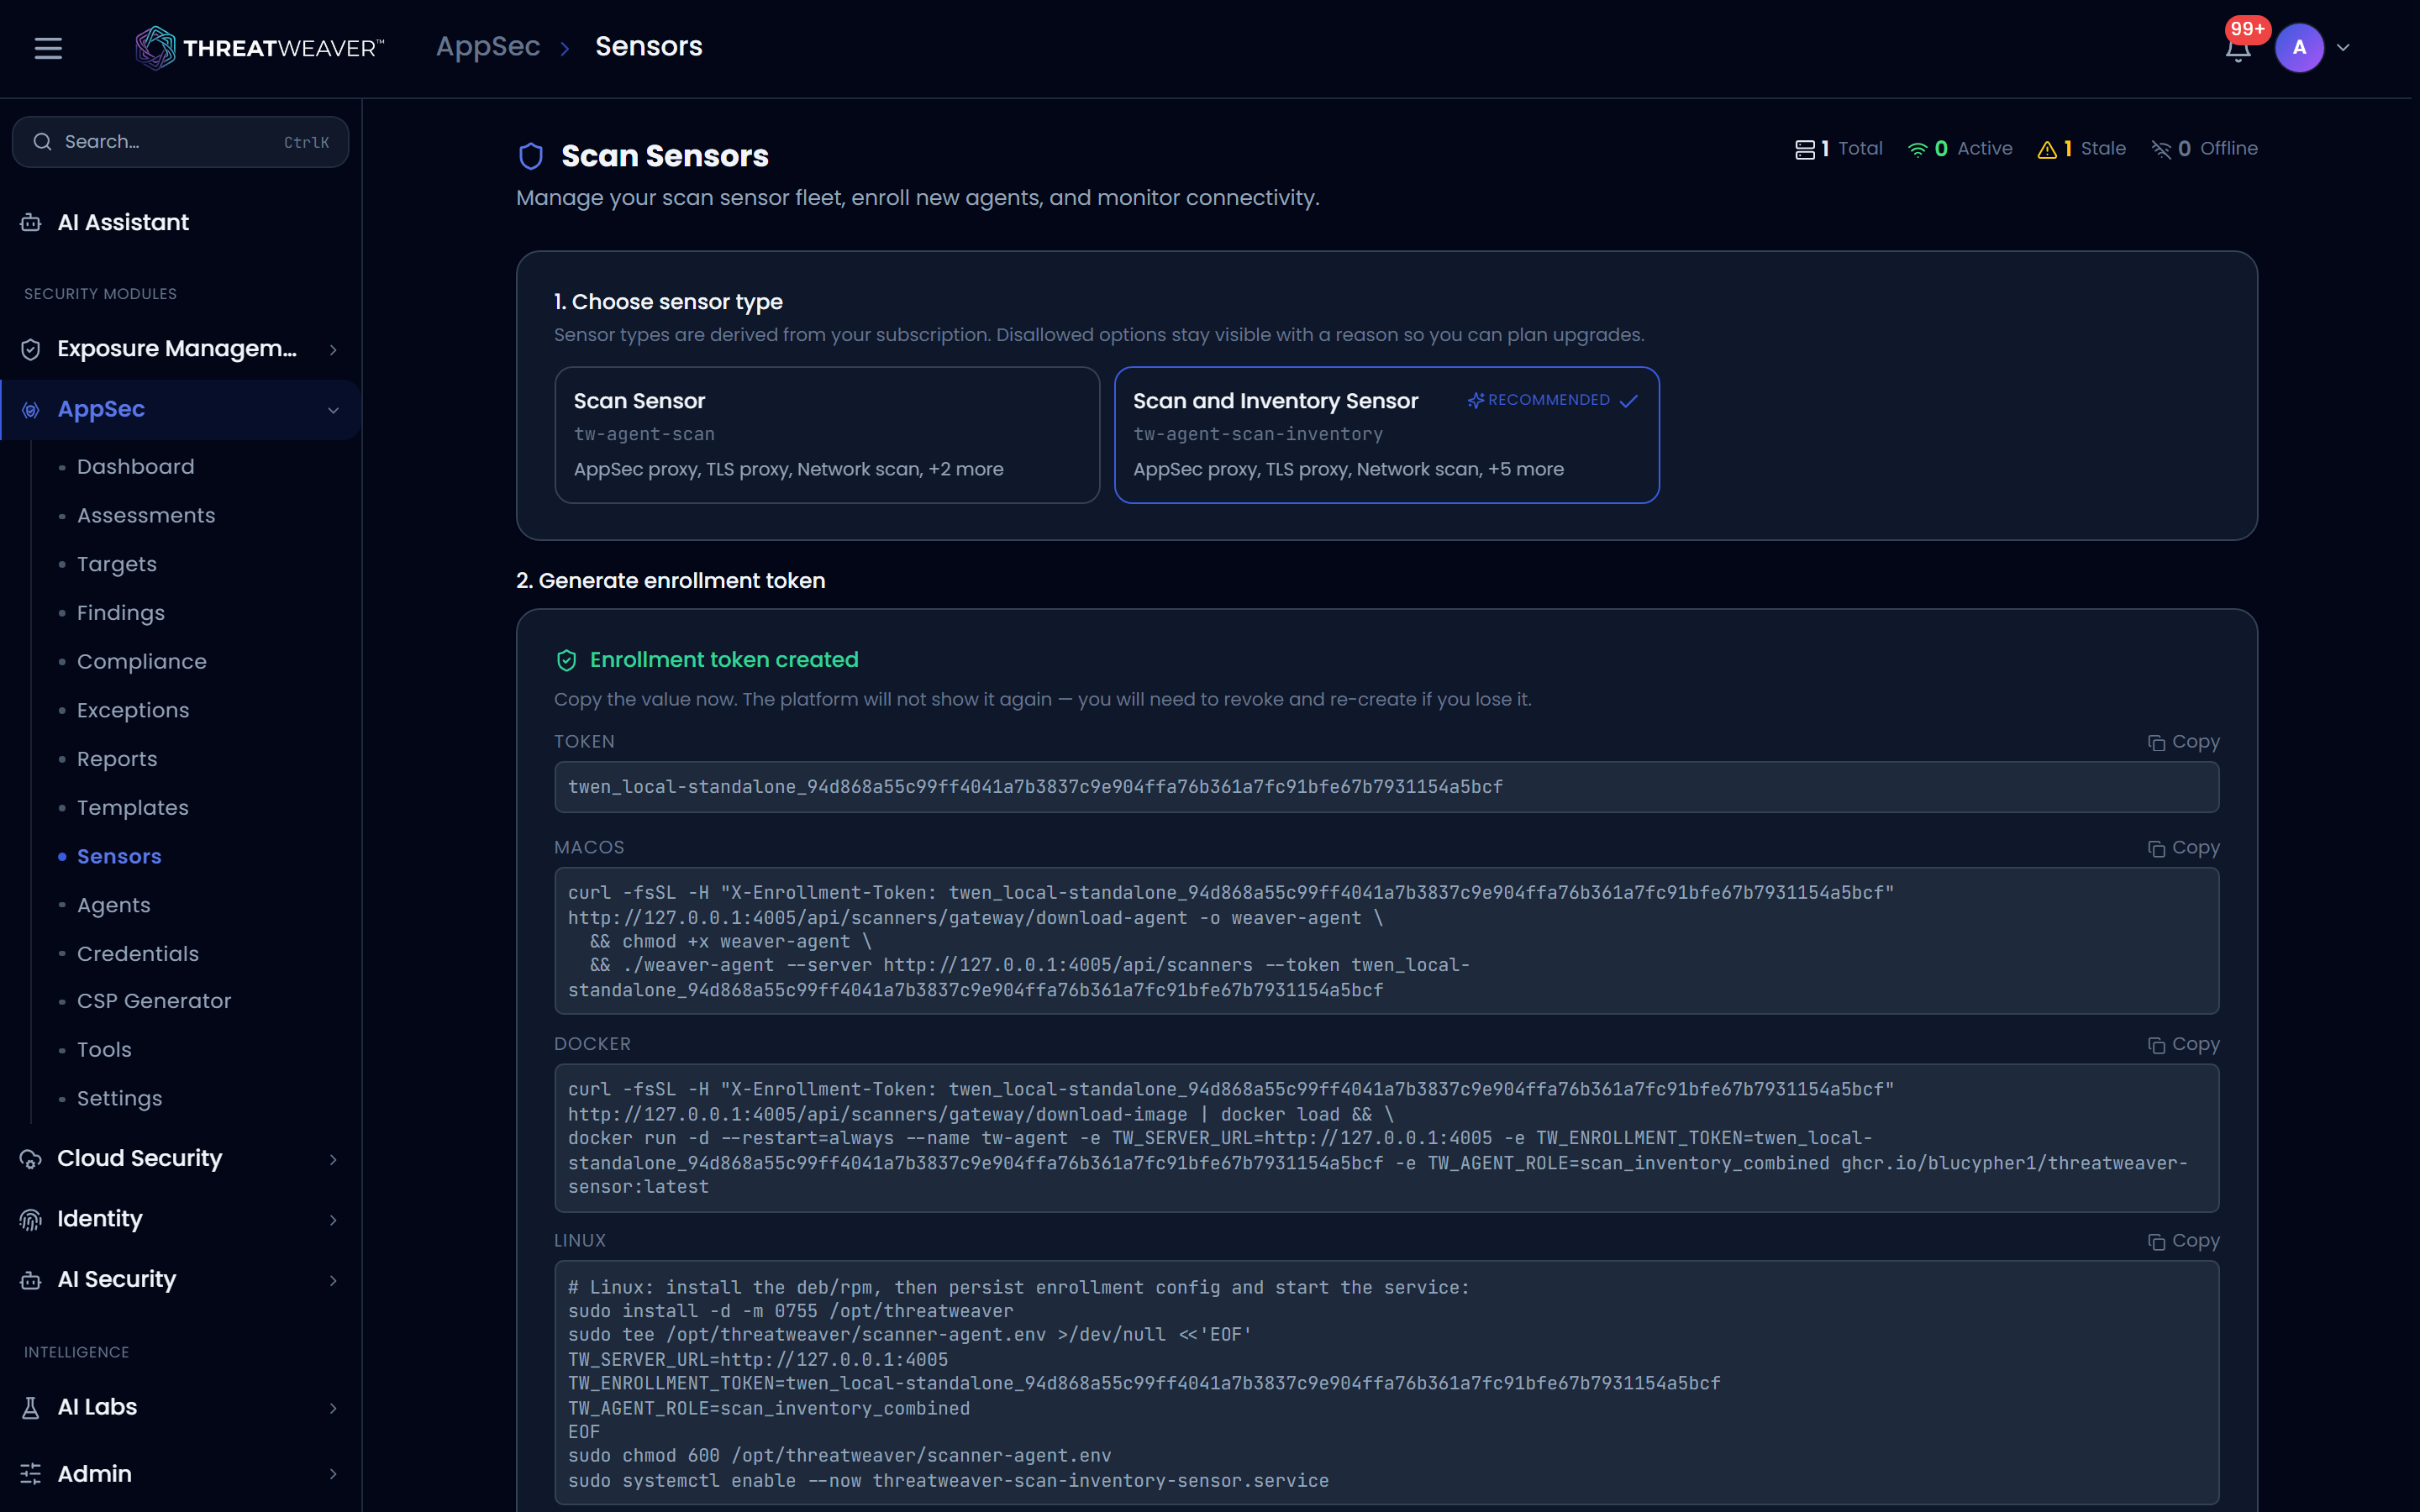
- Run the install command on the host that will run the sensor. It appears in Connected Sensors once it checks in.
Workflow: investigate an unreachable sensor
- Find the sensor in Connected Sensors and check its Status and Heartbeat columns.
- Click Check connectivity (signal icon) to run a fresh check and see the latency or the failure reason.
- Click View details & logs to open the sensor's detail panel and review Recent Activity for what changed.
- If you suspect the sensor's connection or access key has been compromised, use Rotate mTLS Key or Regenerate on the Sensor Access Key from the detail panel.