AI Labs
Sensors and AI Settings
Two of the nine AI Labs tools handle configuration rather than day-to-day drafting: Sensors, where you connect local AI compute, and Settings (its panel is titled AI Settings), where you configure providers, governance, cost, and routing. Both live in the same AI Labs tab as the generators and chat, at the right end of the tab row.
What it's for
- Bring your own AI compute: deploy a sensor so a local or private model (through Ollama or LM Studio) can serve AI requests instead of routing to a cloud provider.
- Choose and configure your AI provider: cloud or local, set the default model, and confirm the connection works.
- Govern how AI is used: for administrators, set capacity limits, spend caps, prompt templates, and per-task-type routing.
- See what it's costing and how it's performing: usage stats, request logs, and a cost dashboard.
The screens in it
- Sensors has two sub-views: Connected sensors, a fleet view of every AI bridge sensor you or your organization have deployed, and Deploy a sensor, which walks you through enrolling a new one.
- AI Settings is a row of sub-tabs. Everyone sees Providers, Usage, and Logs; administrators additionally see Governance, Prompts, Cost policy, Cost & ROI, and Routing.

Every control explained
Sensors: Connected sensors
| Control | What it does |
|---|---|
| Registered / Connected / Scope / Models & Queue stat cards | A quick summary: how many sensors are registered, how many are currently connected, the personal-vs-organization split, and how many models are loaded across them, with current active and queued request counts. |
| Sensor table | Every sensor you can see, with its connection status and bridge details. Click a row's health icon to open a detail drawer with its full telemetry. |
| Refresh | Reloads the list. |
If no sensors are registered yet, the table explains that Deploy a sensor enrolls a personal laptop bridge or an organization bridge server for local model routing.
Sensors: Deploy a sensor
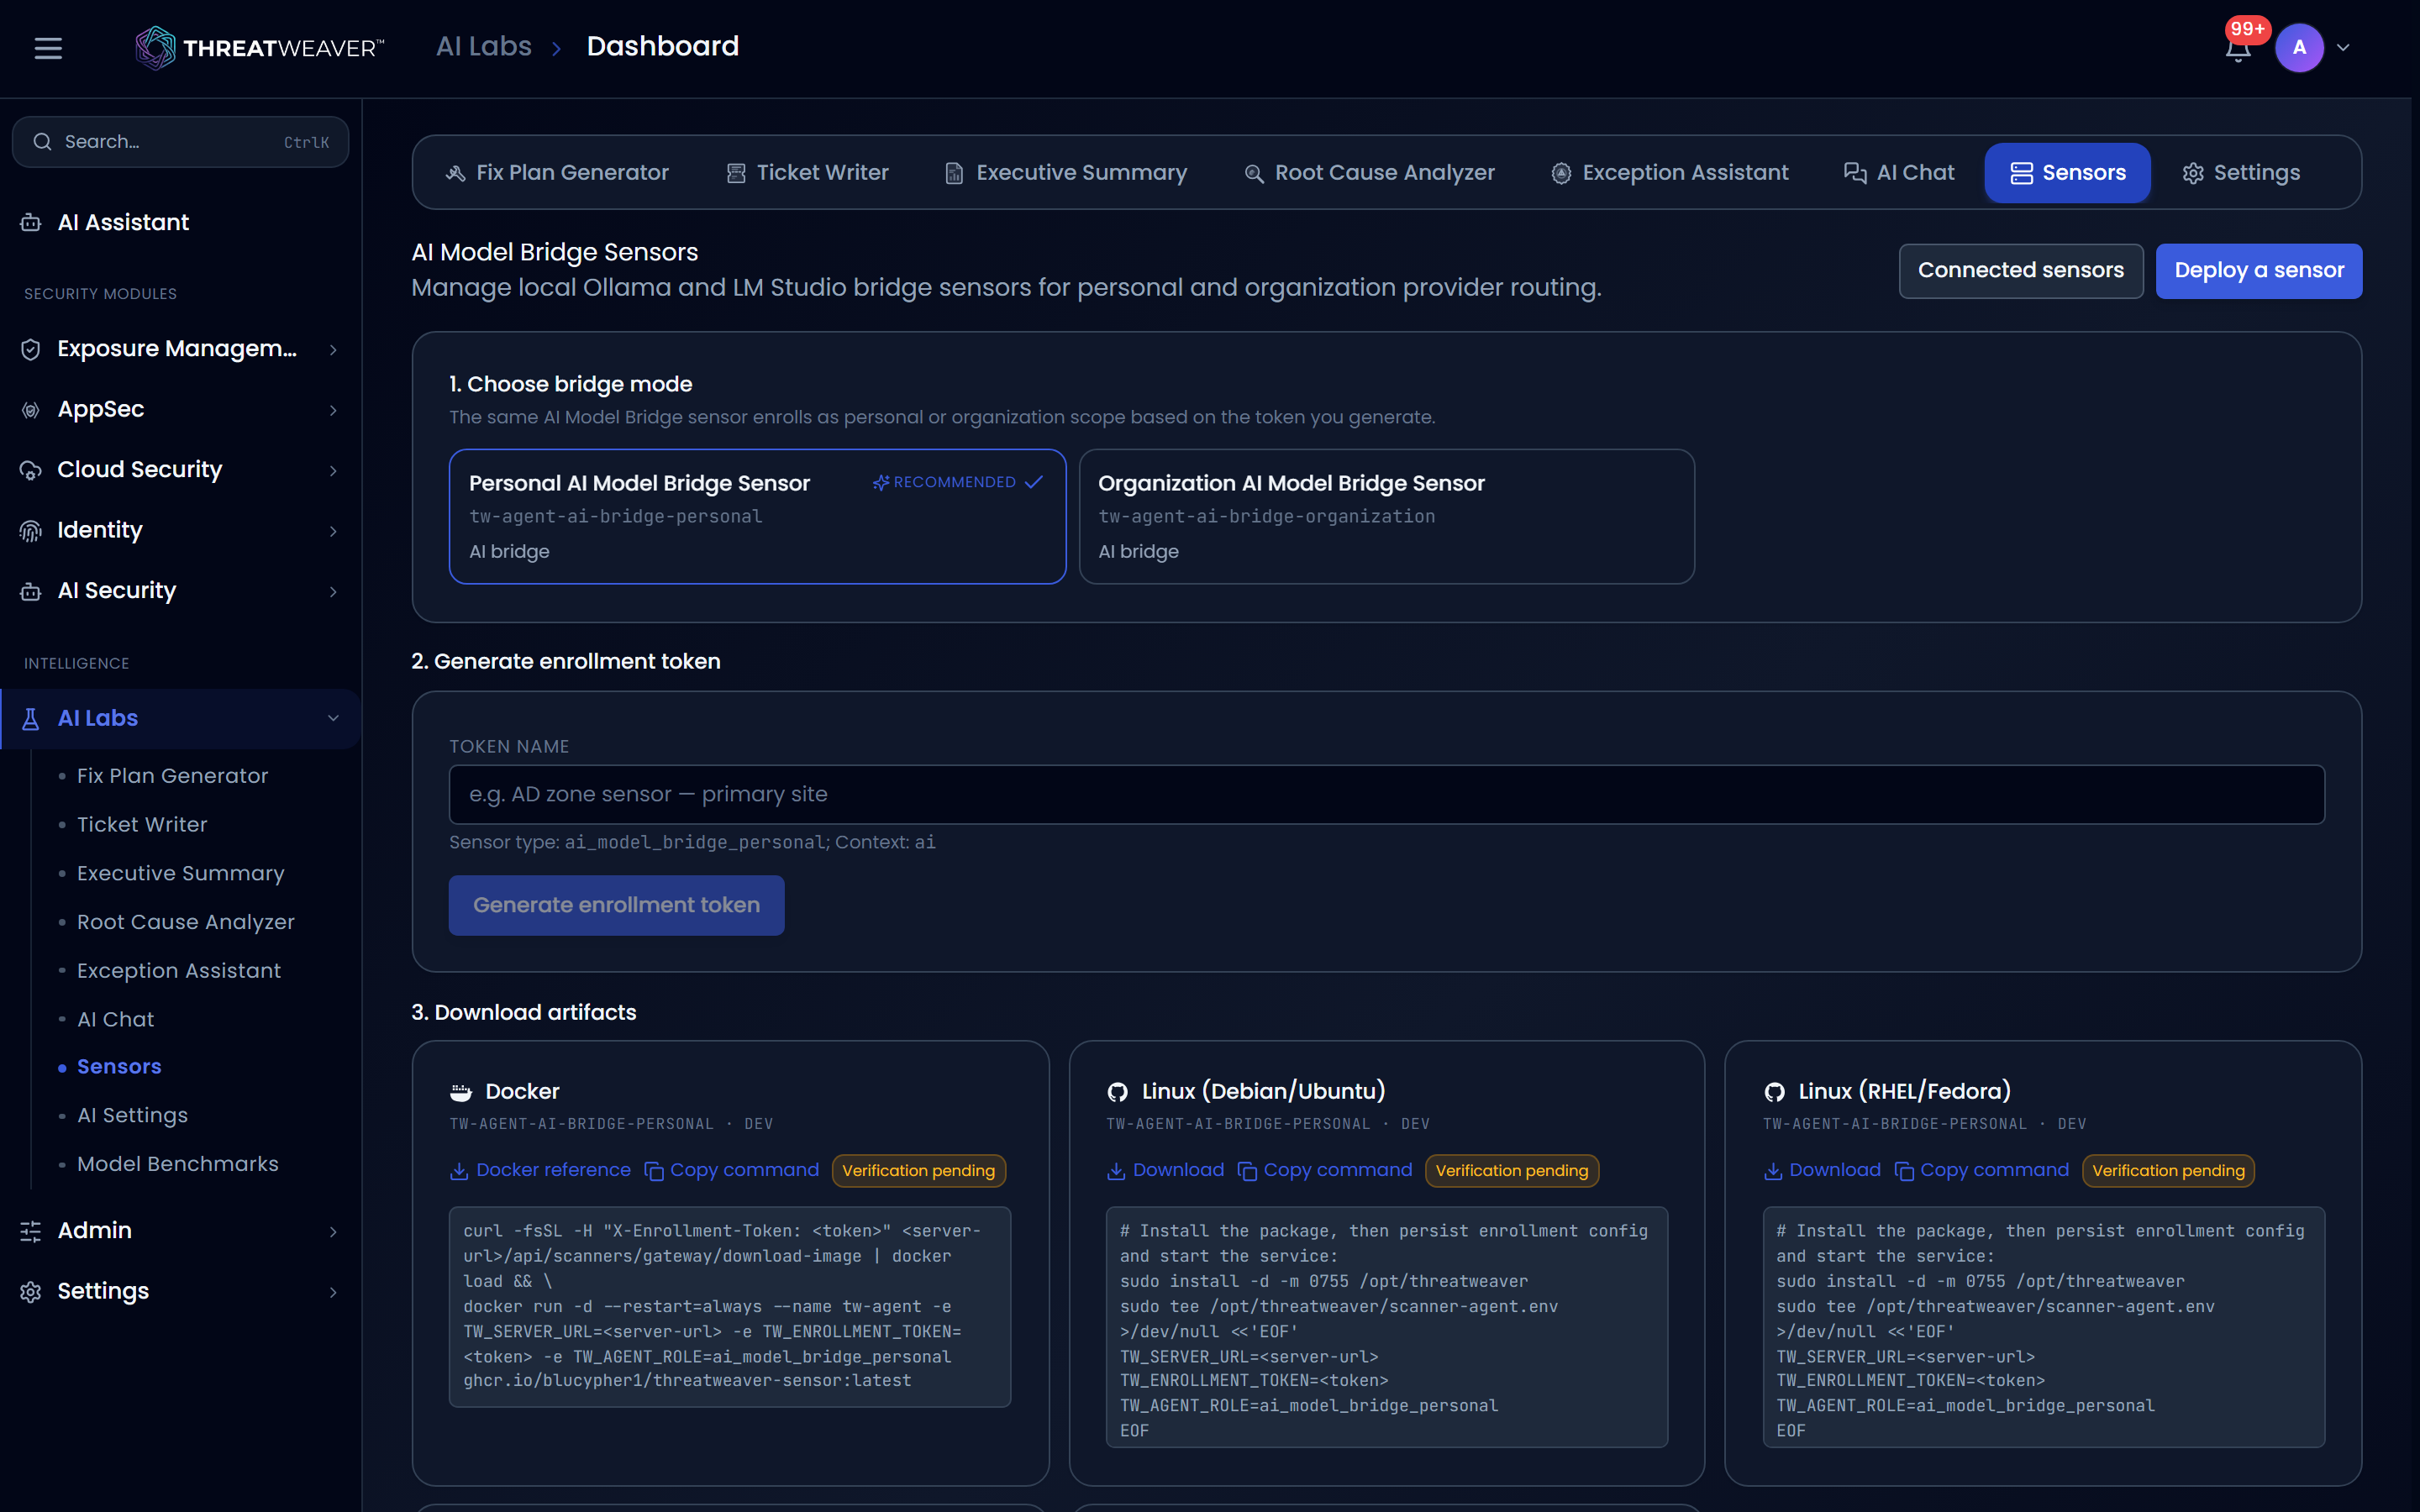
Deploying a sensor walks you through generating an enrollment token. The same sensor software enrolls as personal or organization scope depending on which token you generate: personal sensors serve only your own AI requests; organization sensors can serve anyone in your workspace, subject to what an administrator allows in Governance.
AI Settings: Providers
This tab has two sections with different access.
Personal Providers: everyone can add, configure, test, and delete their own provider here. It's your own API key or your own local Ollama/LM Studio endpoint, used only for your requests.
| Control | What it does |
|---|---|
| Add Provider | Adds a personal provider: a cloud provider (API key) or a local runtime (connection endpoint). |
| Set Default | Makes this your preferred provider when a task doesn't specify one. |
| Validate | For a cloud provider, checks your API key and, on success, discovers the models available from it. |
| Delete | Removes your personal provider. |
Organization Providers: a tenant-wide fallback used when someone doesn't have (or hasn't set) a personal provider. Everyone can see this list; only an administrator can add or change one.
| Control | What it does |
|---|---|
| Provider list | The AI providers configured for the whole workspace: cloud providers such as OpenAI, Anthropic, or OpenRouter, and local runtimes such as Ollama or LM Studio. |
| Set Default | Makes a provider the one used when a task doesn't specify one. |
| Configure | Opens a provider for configuration: an API key and model for a cloud provider, or a connection endpoint and model for a local runtime. Also sets Max Tokens and Temperature. |
| Test connection (cloud: Validate button; local: an unlabeled icon button) | Validates the credentials or endpoint and, on success, automatically discovers the models available from that provider. |
For a local provider (Ollama or LM Studio), you additionally choose how requests reach it:
- Direct: ThreatWeaver connects straight to the local endpoint you enter.
- Via bridge sensor: requests route through a deployed AI Model Bridge sensor instead. Pick a connected sensor from the list; its live model count and request queue are shown next to it, and a clear notice appears if the selected sensor is offline or has no AI runtime reachable from it.
AI Settings: Usage
Everyone can see their own and workspace-wide usage here.
- Overall Usage: total requests, total tokens, the current active provider, and total conversations across your workspace.
- Usage by Feature: a bar chart of requests per AI Labs tool.
- Daily Usage: a trend line of requests over the last 30 days.
- Provider Breakdown: the share of requests handled by each configured provider.
- My Usage: your own request, token, and conversation counts.
AI Settings: Logs
A record of AI requests from the last 7 days, for everyone to see.
| Control | What it does |
|---|---|
| Source filter | Narrows the list to All, AI Provider, Local Query, Cache Hit, or Mock. |
| Refresh | Reloads the list. |
| Log row | Click to expand it. Shows the model and provider used, input/output token counts, whether the request was sanitized, the exact timestamp, and the full prompt and response text (or the error, if the request failed). |
| Previous / Next | Pages through the list when there's more than one page. |
AI Settings: Governance (administrator)
Tenant-wide controls for AI Model Bridge sensors.
- Scope and approval: turn personal and organization sensors on or off, and require administrator approval (or not) before each kind can be used.
- Discovery and telemetry: allow or block runtime discovery, model inventory, and health telemetry from being reported.
- Capacity limits: caps on sensors per user/tenant, bindings per user/tenant, concurrent requests (per user, tenant, binding, and sensor), queue depth, request timeout, maximum chunk and payload size, maximum context tokens, and how long sensor metadata is retained.
- Audit retention: the audit detail level (Minimal, Standard, or Verbose), how much of the prompt and response text is retained (Disabled, Redacted, or Full) for each, and a toggle to redact prompt and response bodies outright.
AI Settings: Prompts (administrator)
Manage the prompt templates behind each generator.
| Control | What it does |
|---|---|
| Feature filter | Narrows the list to prompts for one AI Labs tool. |
| Seed Prompts | Populates the default prompt templates if none are configured yet. |
| Edit | Opens a prompt for editing: its System Prompt (instructions for the AI) and User Prompt Template (which can include {{variable}} placeholders that get filled in with real values at generation time). |
AI Settings: Cost policy (administrator)
Caps how much your workspace can spend on AI.
| Control | What it does |
|---|---|
| Policy enabled | Turns the spend cap on or off. |
| Hard enforce | When on, calls that would exceed a cap are blocked. When off, spend is tracked and shown but never blocks a request. |
| Max monthly / daily / per-scan (USD) | Spend ceilings for each time window. Leave a field blank to leave that dimension unlimited. |
AI Settings: Cost & ROI (administrator)
A spend dashboard for a selectable time window (7, 30, or 90 days).
- Today / Month-to-date / Projected monthly / Monthly cap: summary cards, each flagged if spend is over its cap or projected to be by month end.
- Daily spend: a trend chart across the selected window.
- Spend by feature: which AI Labs tools are driving the spend.
- Top scans by spend: the highest-spending scans in the window, where spend has been tagged to a scan.
AI Settings: Routing (administrator)
Controls which provider handles each kind of AI task.
For each task type (Recon, Exploit, Remediation, and Triage), set a preferred provider, an optional fallback provider, a maximum latency, and a cost ceiling, and turn the policy on or off. Each task type shows its latest Model Benchmarks scorecard rows alongside the editor, so you can choose a provider based on its actual pass rate, latency, and cost rather than guessing.
You can add your own personal provider at any time from Settings → Providers. If you see a message that no AI provider is configured at the organization level, or that a proposed provider isn't approved, ask your administrator to set one up there instead. See Admin.
Common workflows
Workflow: route a local AI provider through a bridge sensor
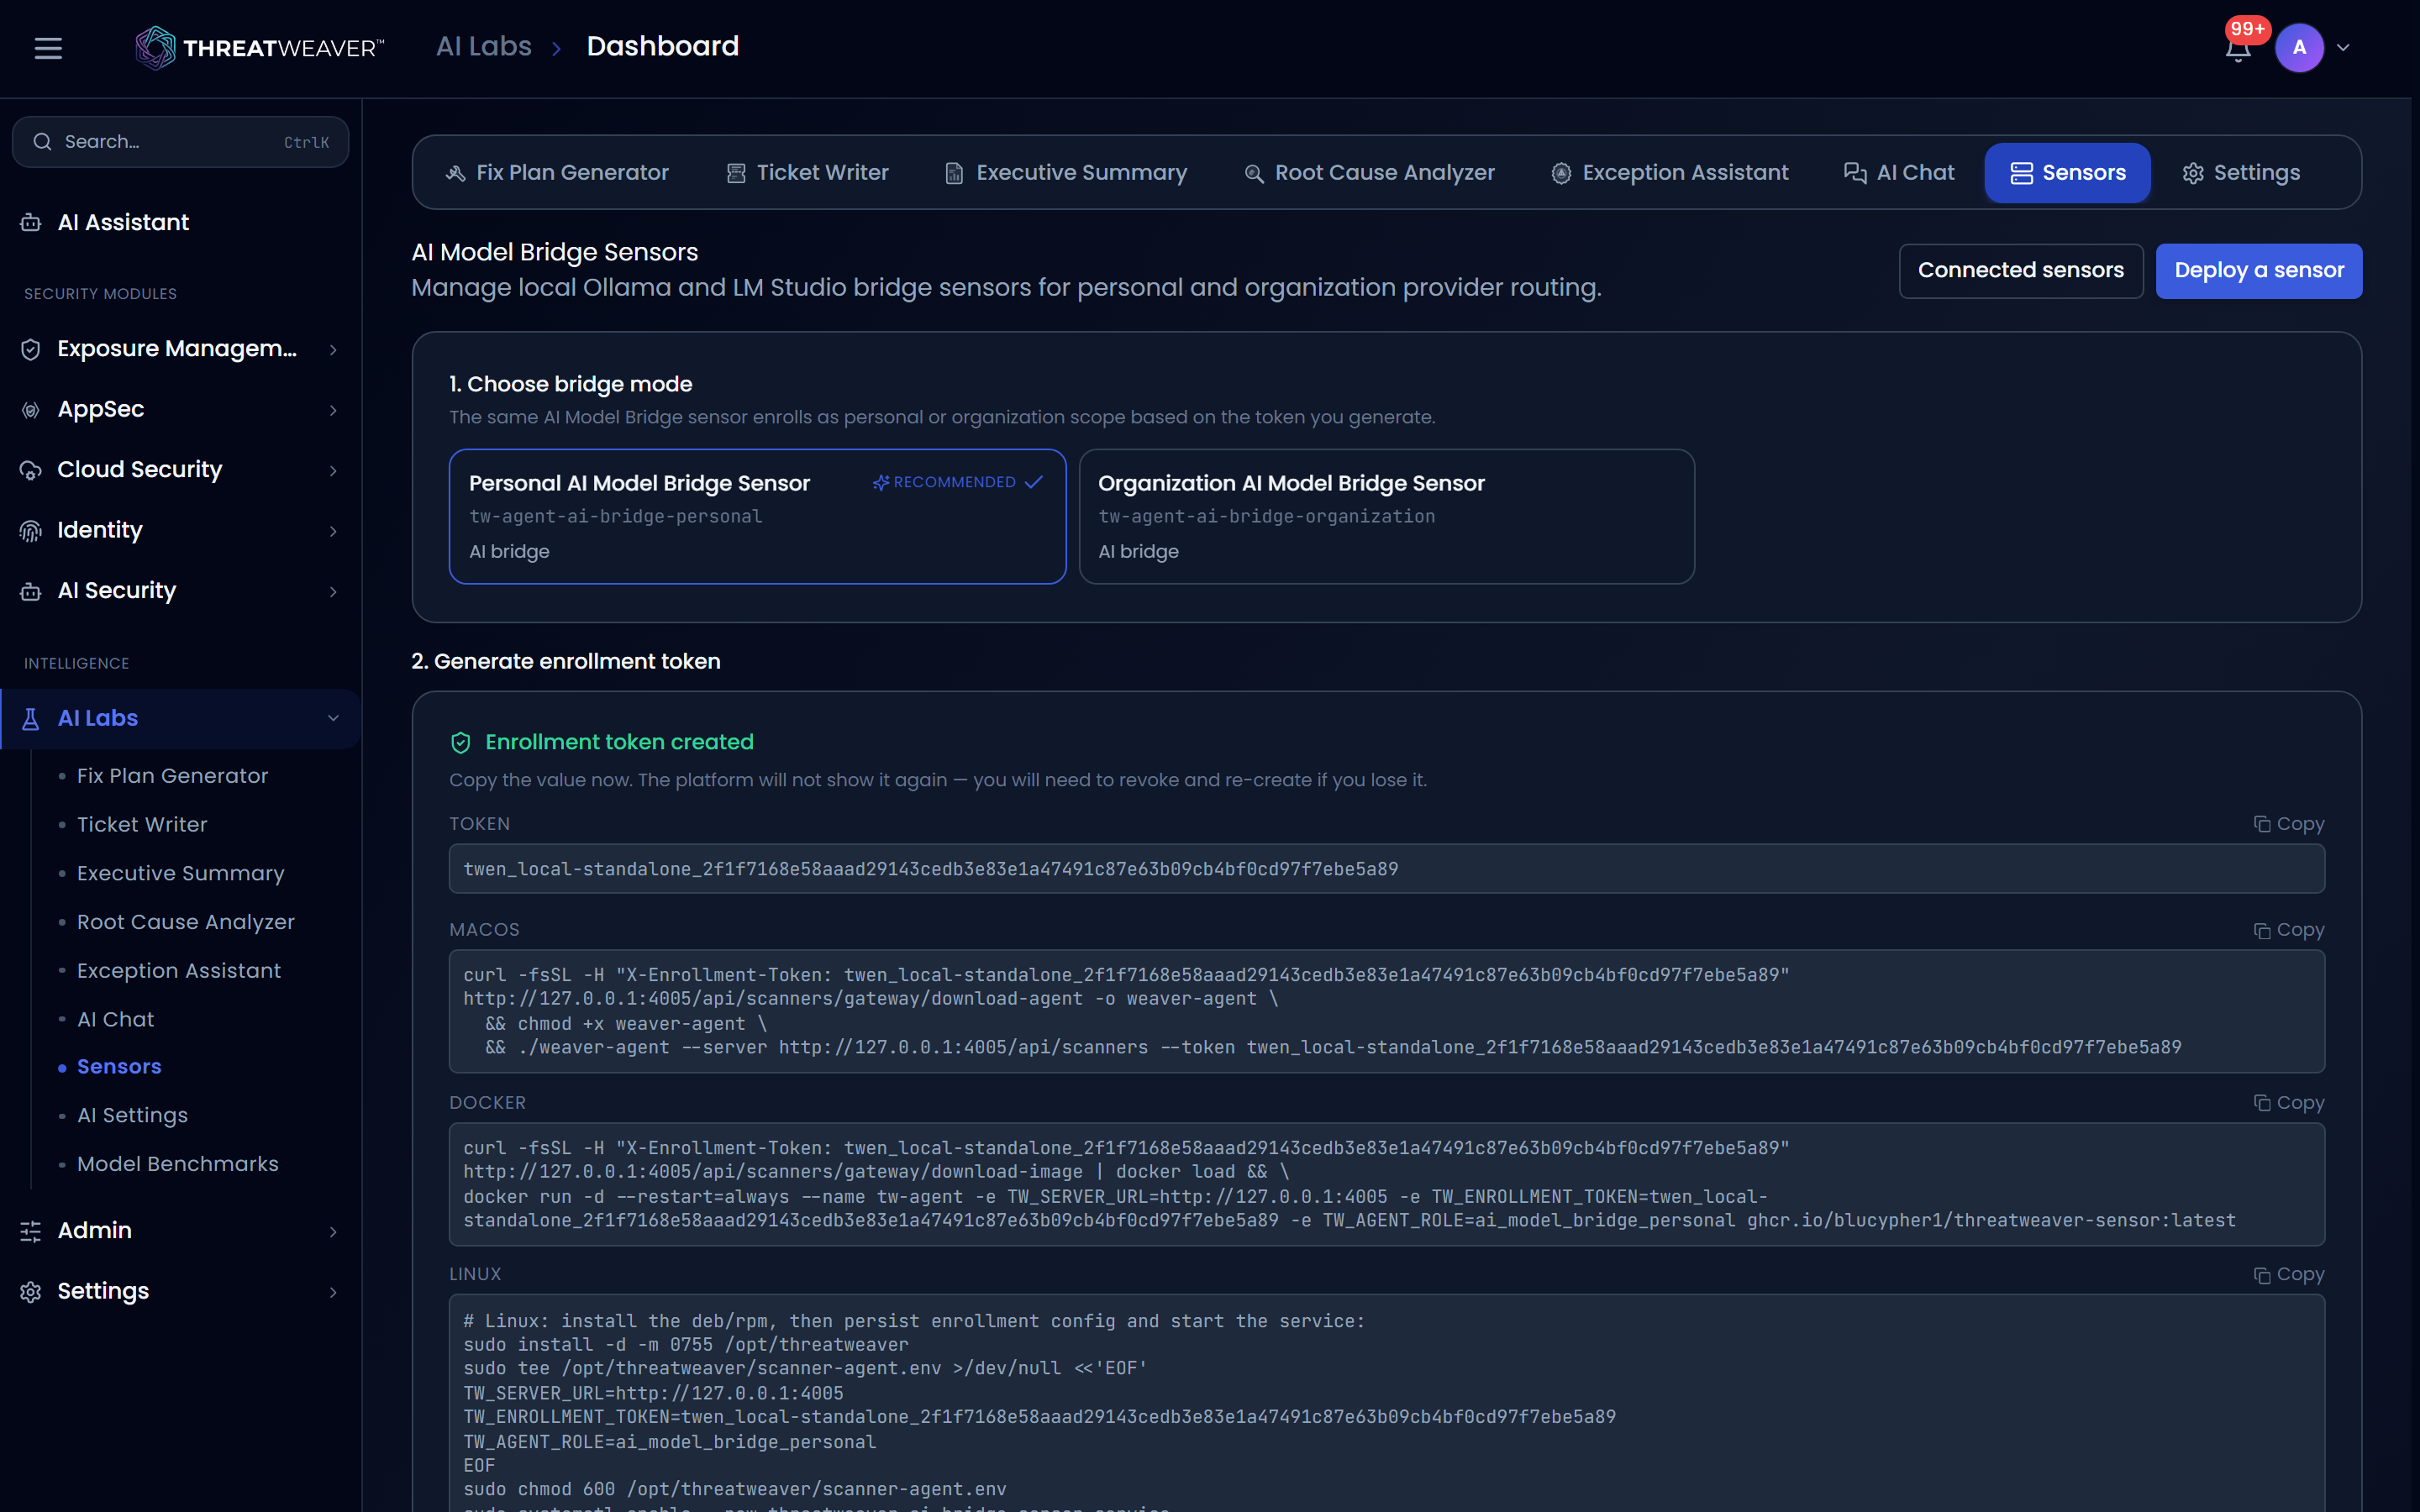
- Open the Sensors tab and click Deploy a sensor. Choose whether the sensor should be personal or organization scope, and generate its enrollment token.
-
Once the sensor shows as connected in Connected sensors, open Settings → Providers and configure your local provider (Ollama or LM Studio).
-
Switch the provider's routing to Via bridge sensor, select the connected sensor, and test the connection to confirm it can reach a model.
Workflow: check today's AI spend and cap it
-
Open Settings → Cost & ROI and review the Today and Month-to-date cards.
-
If spend is trending high, open Cost policy, turn Policy enabled on, and set a Max monthly or Max daily limit in USD.
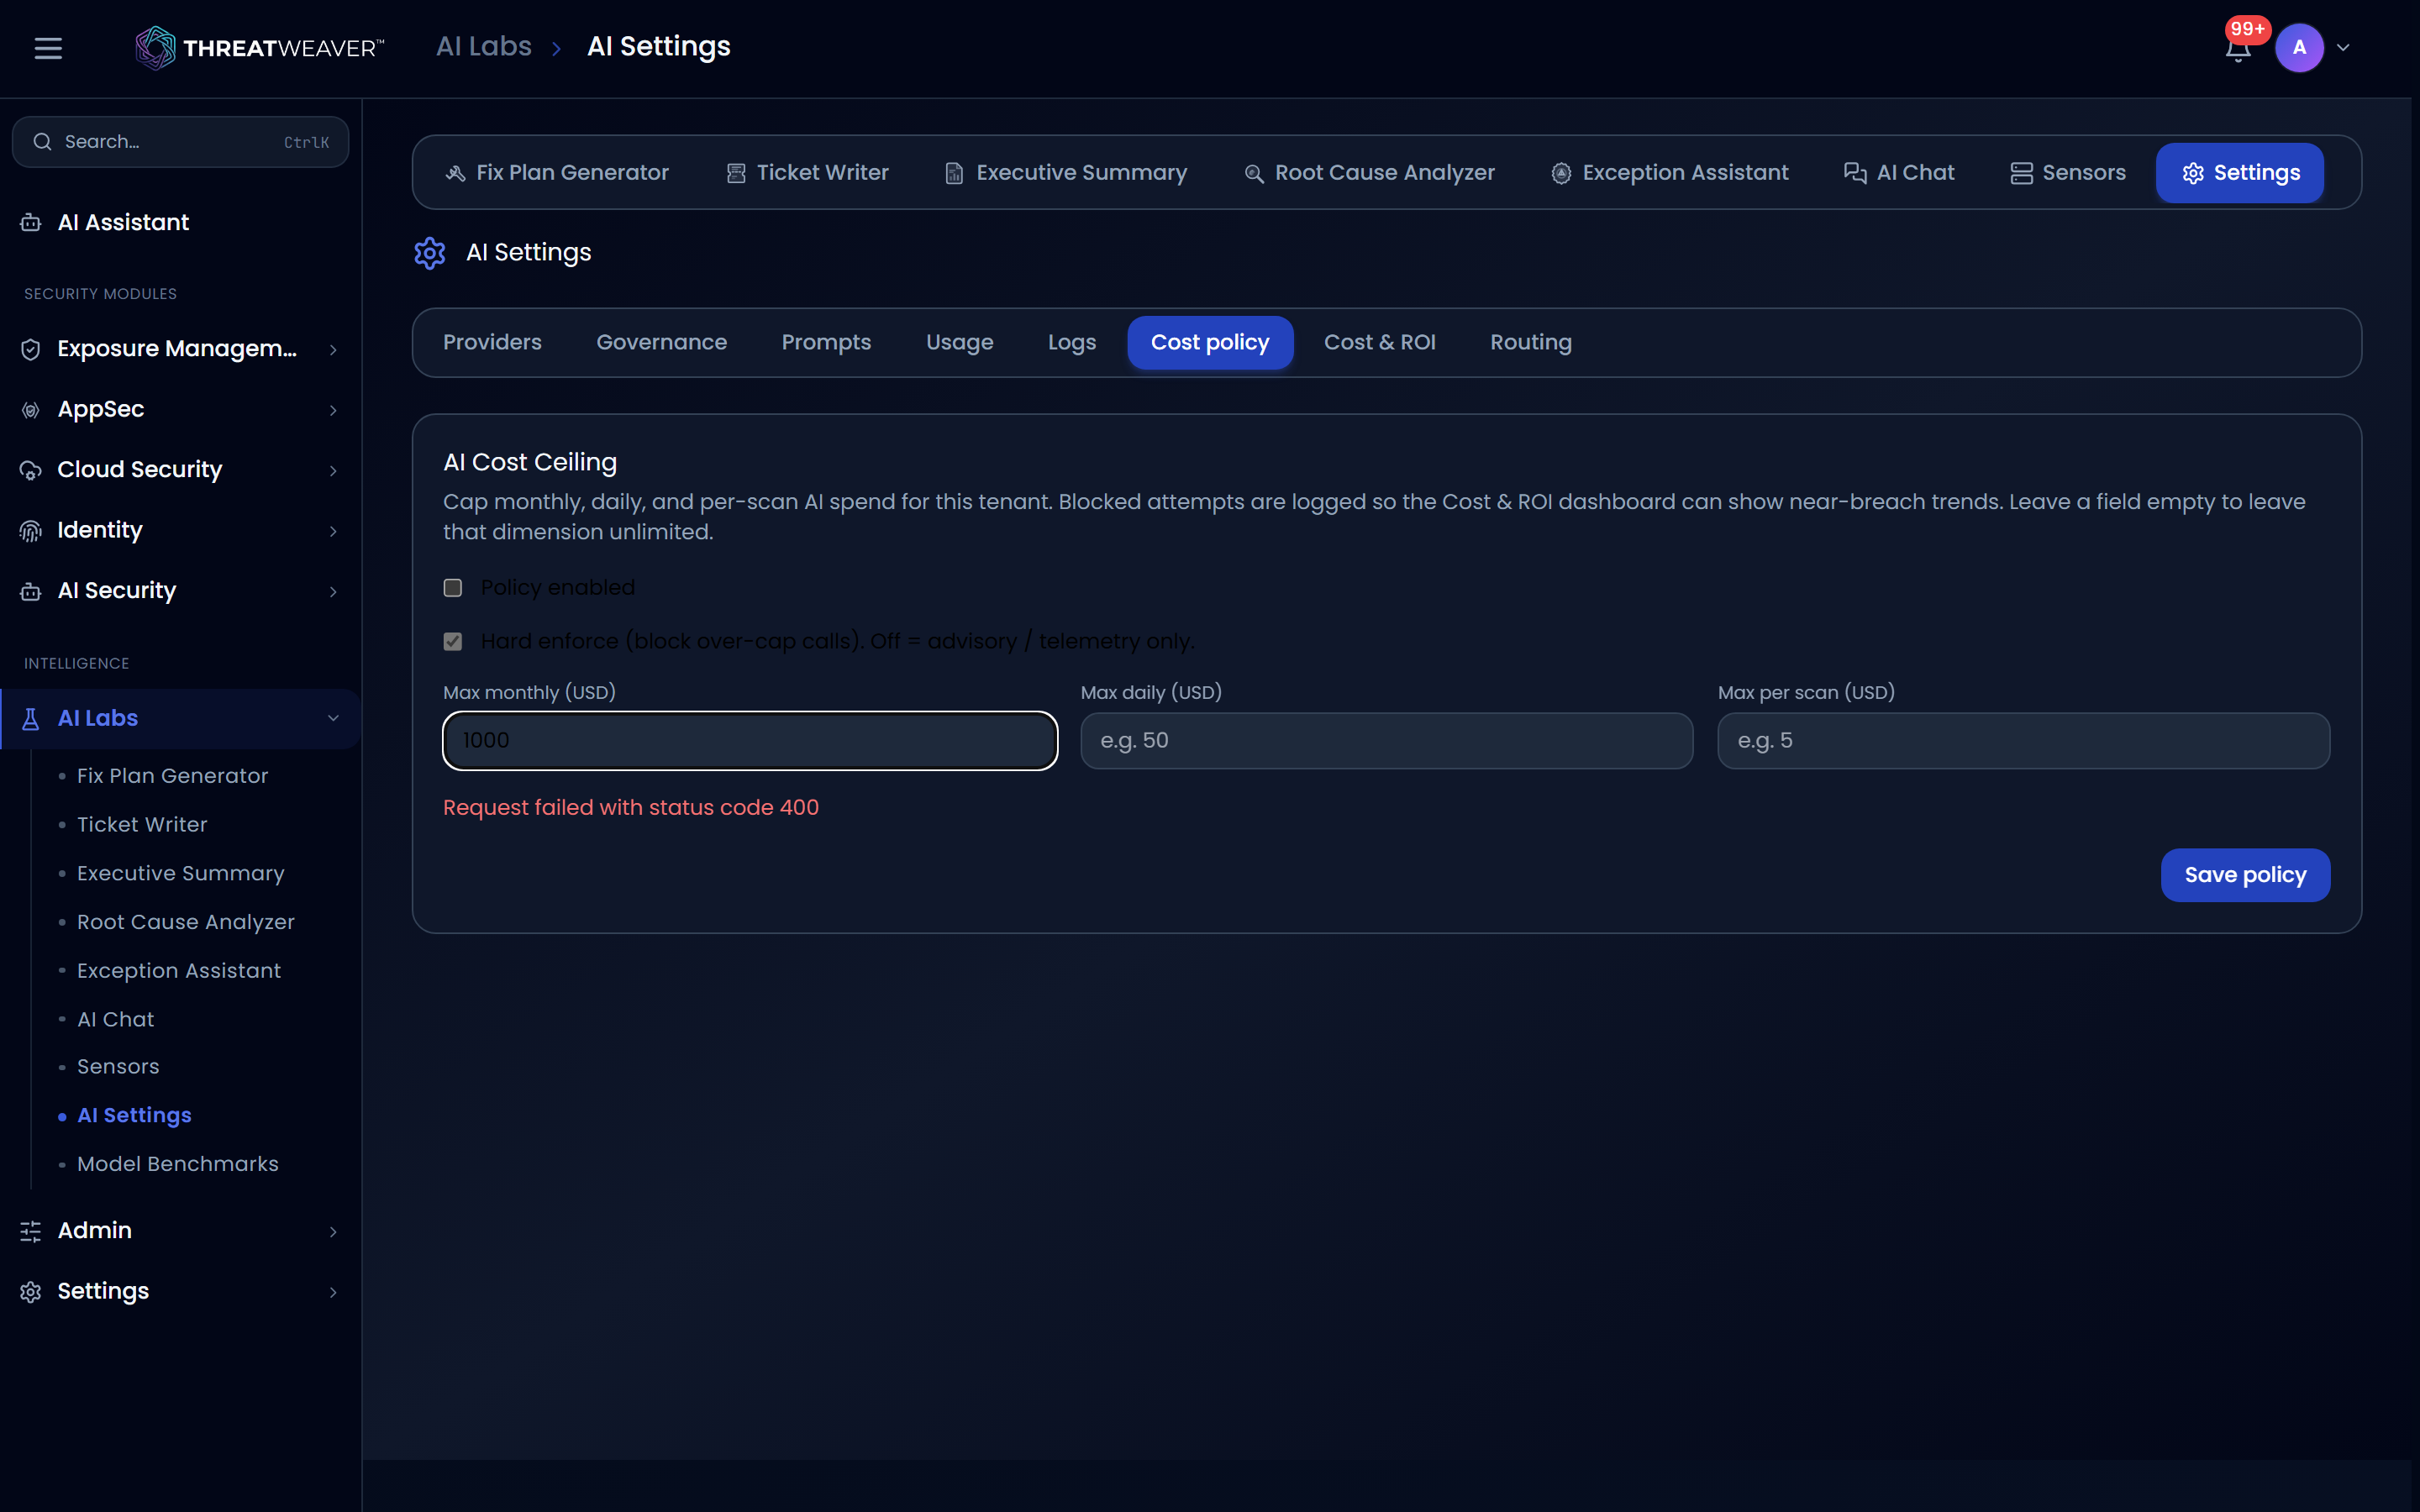
- Turn on Hard enforce if you want over-cap requests blocked rather than just tracked, then click Save policy.