Exposure Management
Assets
The Assets tab is the list of every host your connected scan sources have found: the same population your vulnerability findings are scored against. Use it to see what's in scope, check which hosts are missing an agent, tag assets with a business-criticality level so their risk scoring reflects how important they really are, and act on a selection: scan it, tag it, or export it.
This page is the asset list scoped to your vulnerability-management scan sources. If your workspace also has Cyber Asset Management licensed, its Asset Inventory merges assets from every connected tool (not just scanners) into one reconciled record per asset, with source-agreement and verification tracking. The two lists draw from different data and don't always show the same counts. Use this page for scan-scoped asset work; use Cyber Asset Management when you need the broader, cross-tool picture.
What it's for
- See what's in your scan scope: every host a connected scanner has reported, with its operating system, agent status, and vulnerability counts.
- Narrow a large list by system type, agent coverage, business criticality, severity, and more.
- Flag business-critical assets so their risk scoring reflects real-world impact, individually or in bulk.
- Act on a selection: launch a scan, export it, or open a single asset to see everything found on it.
- Track inventory drift: a second mode shows added, removed, and changed assets, services, and certificates over time.
The screens in it
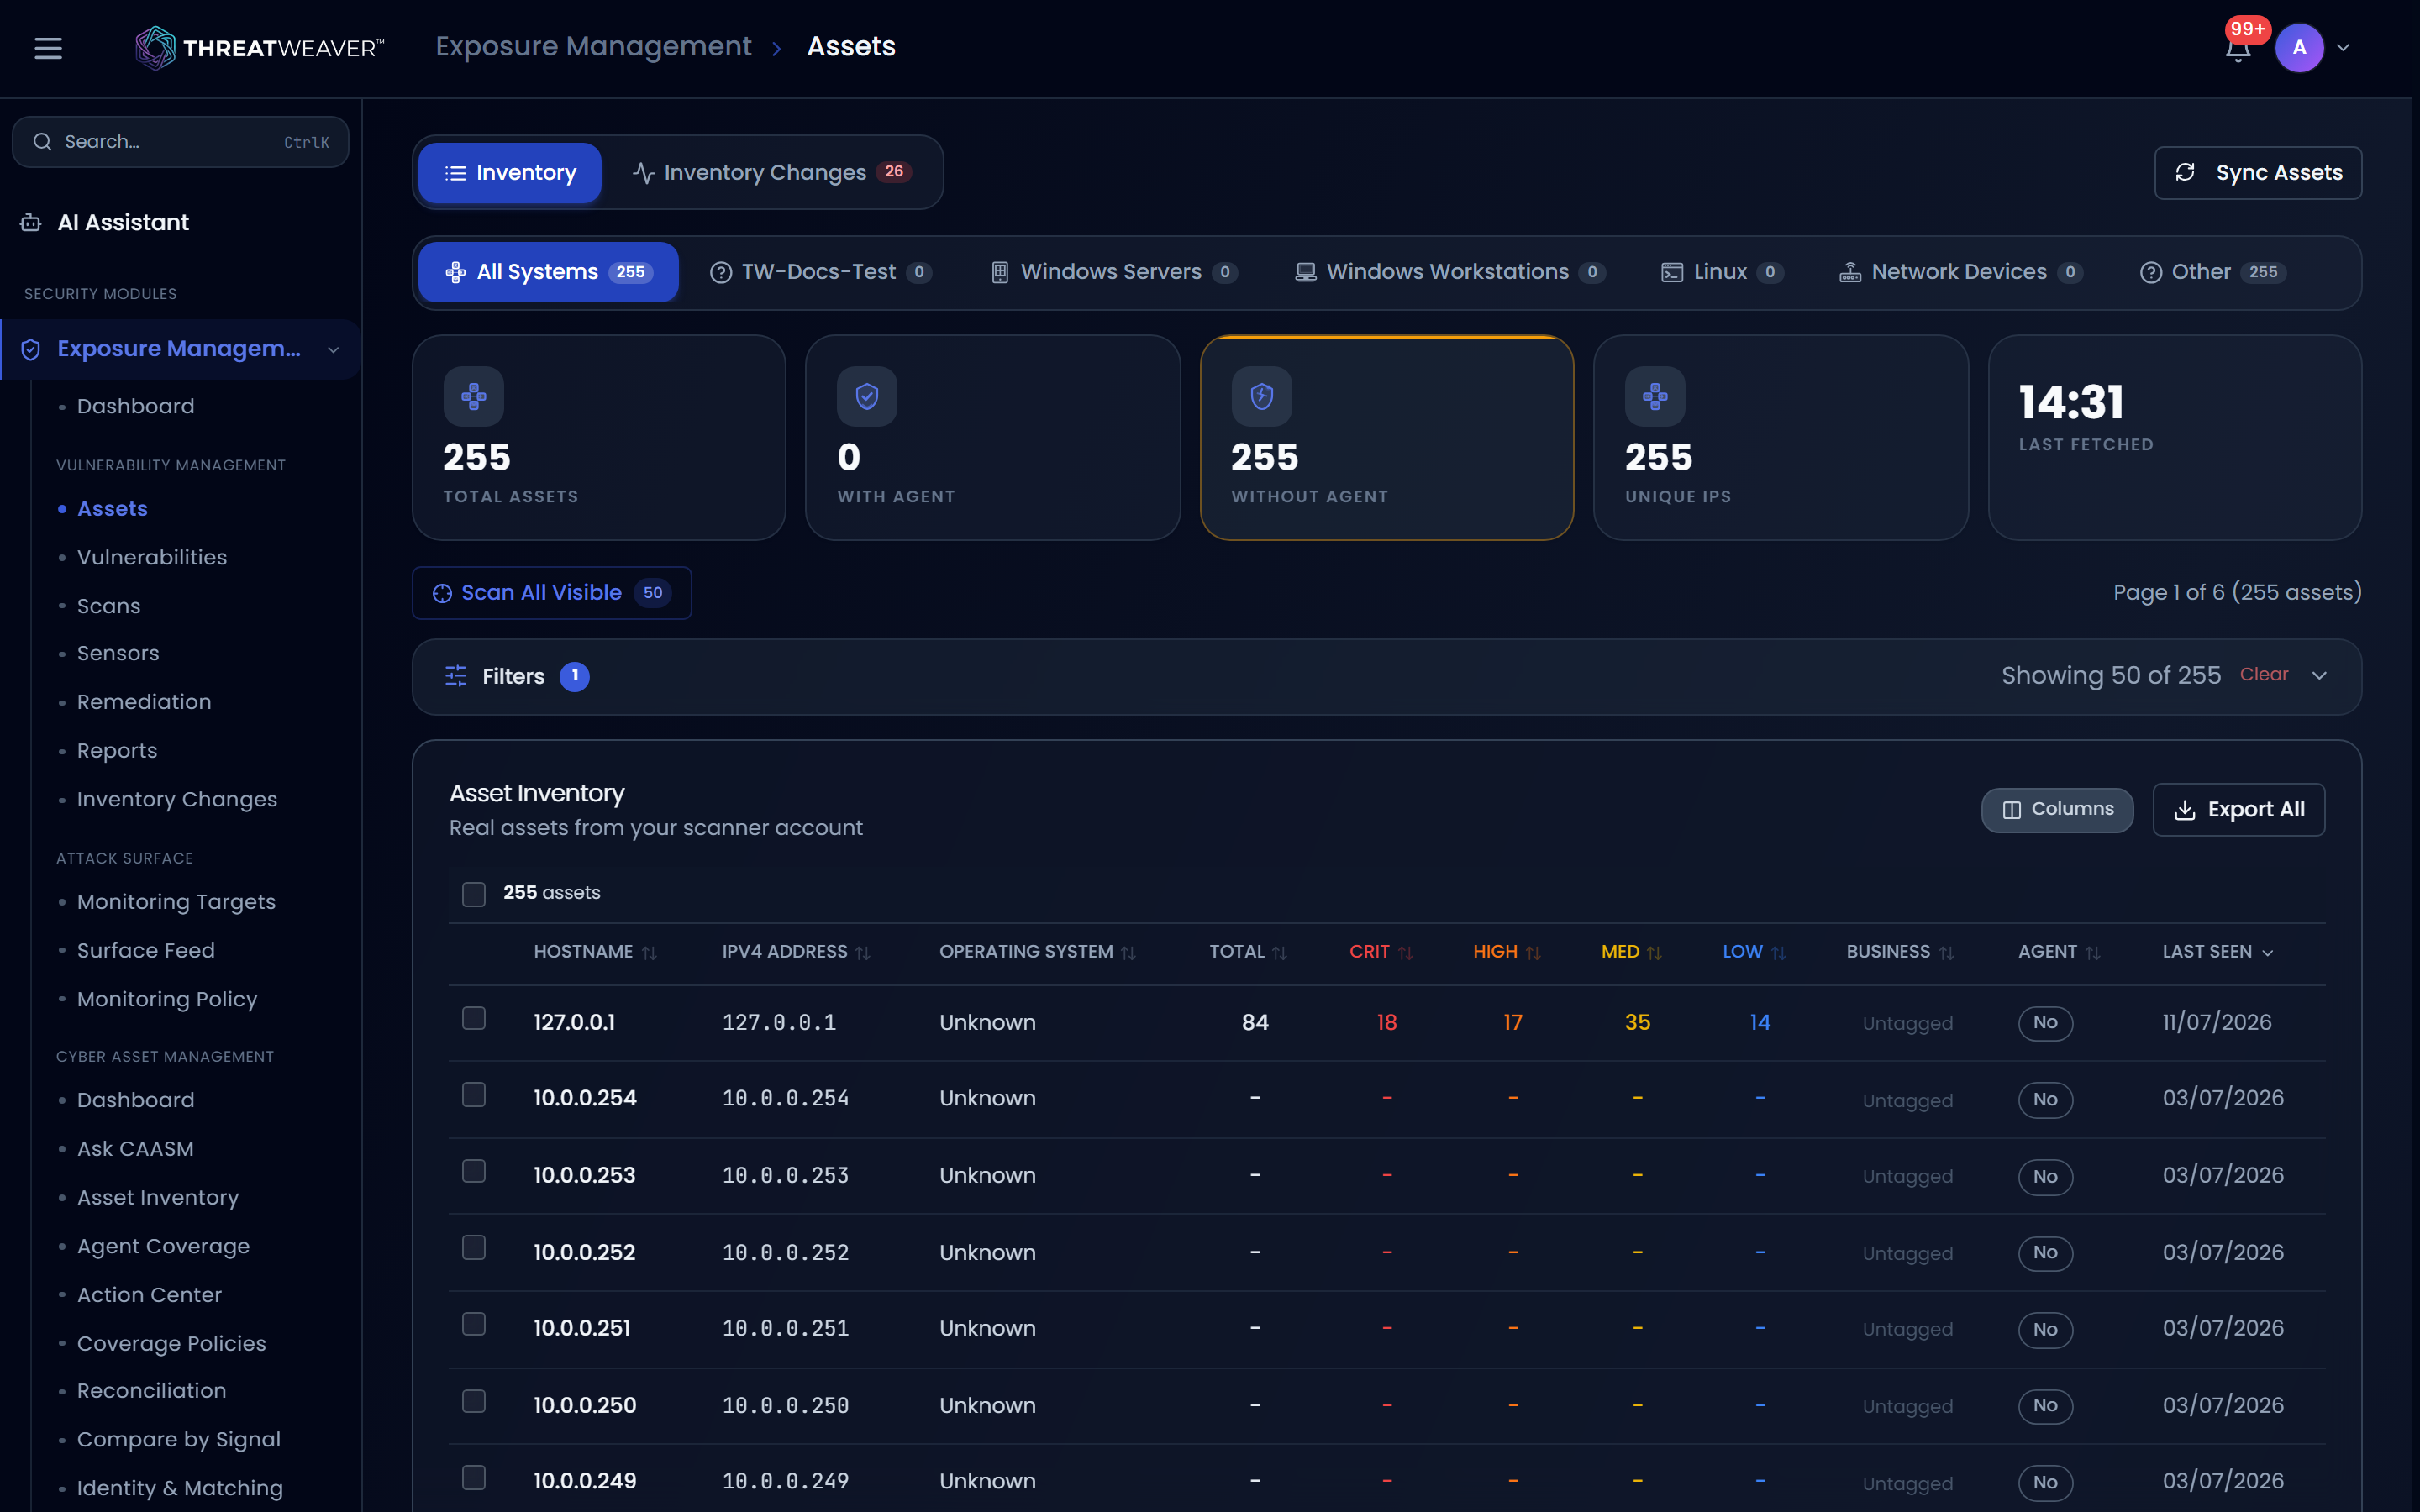
Opening Assets lands you on the Inventory view: system-type tabs, summary cards, a search-and-filter bar, and the asset table.
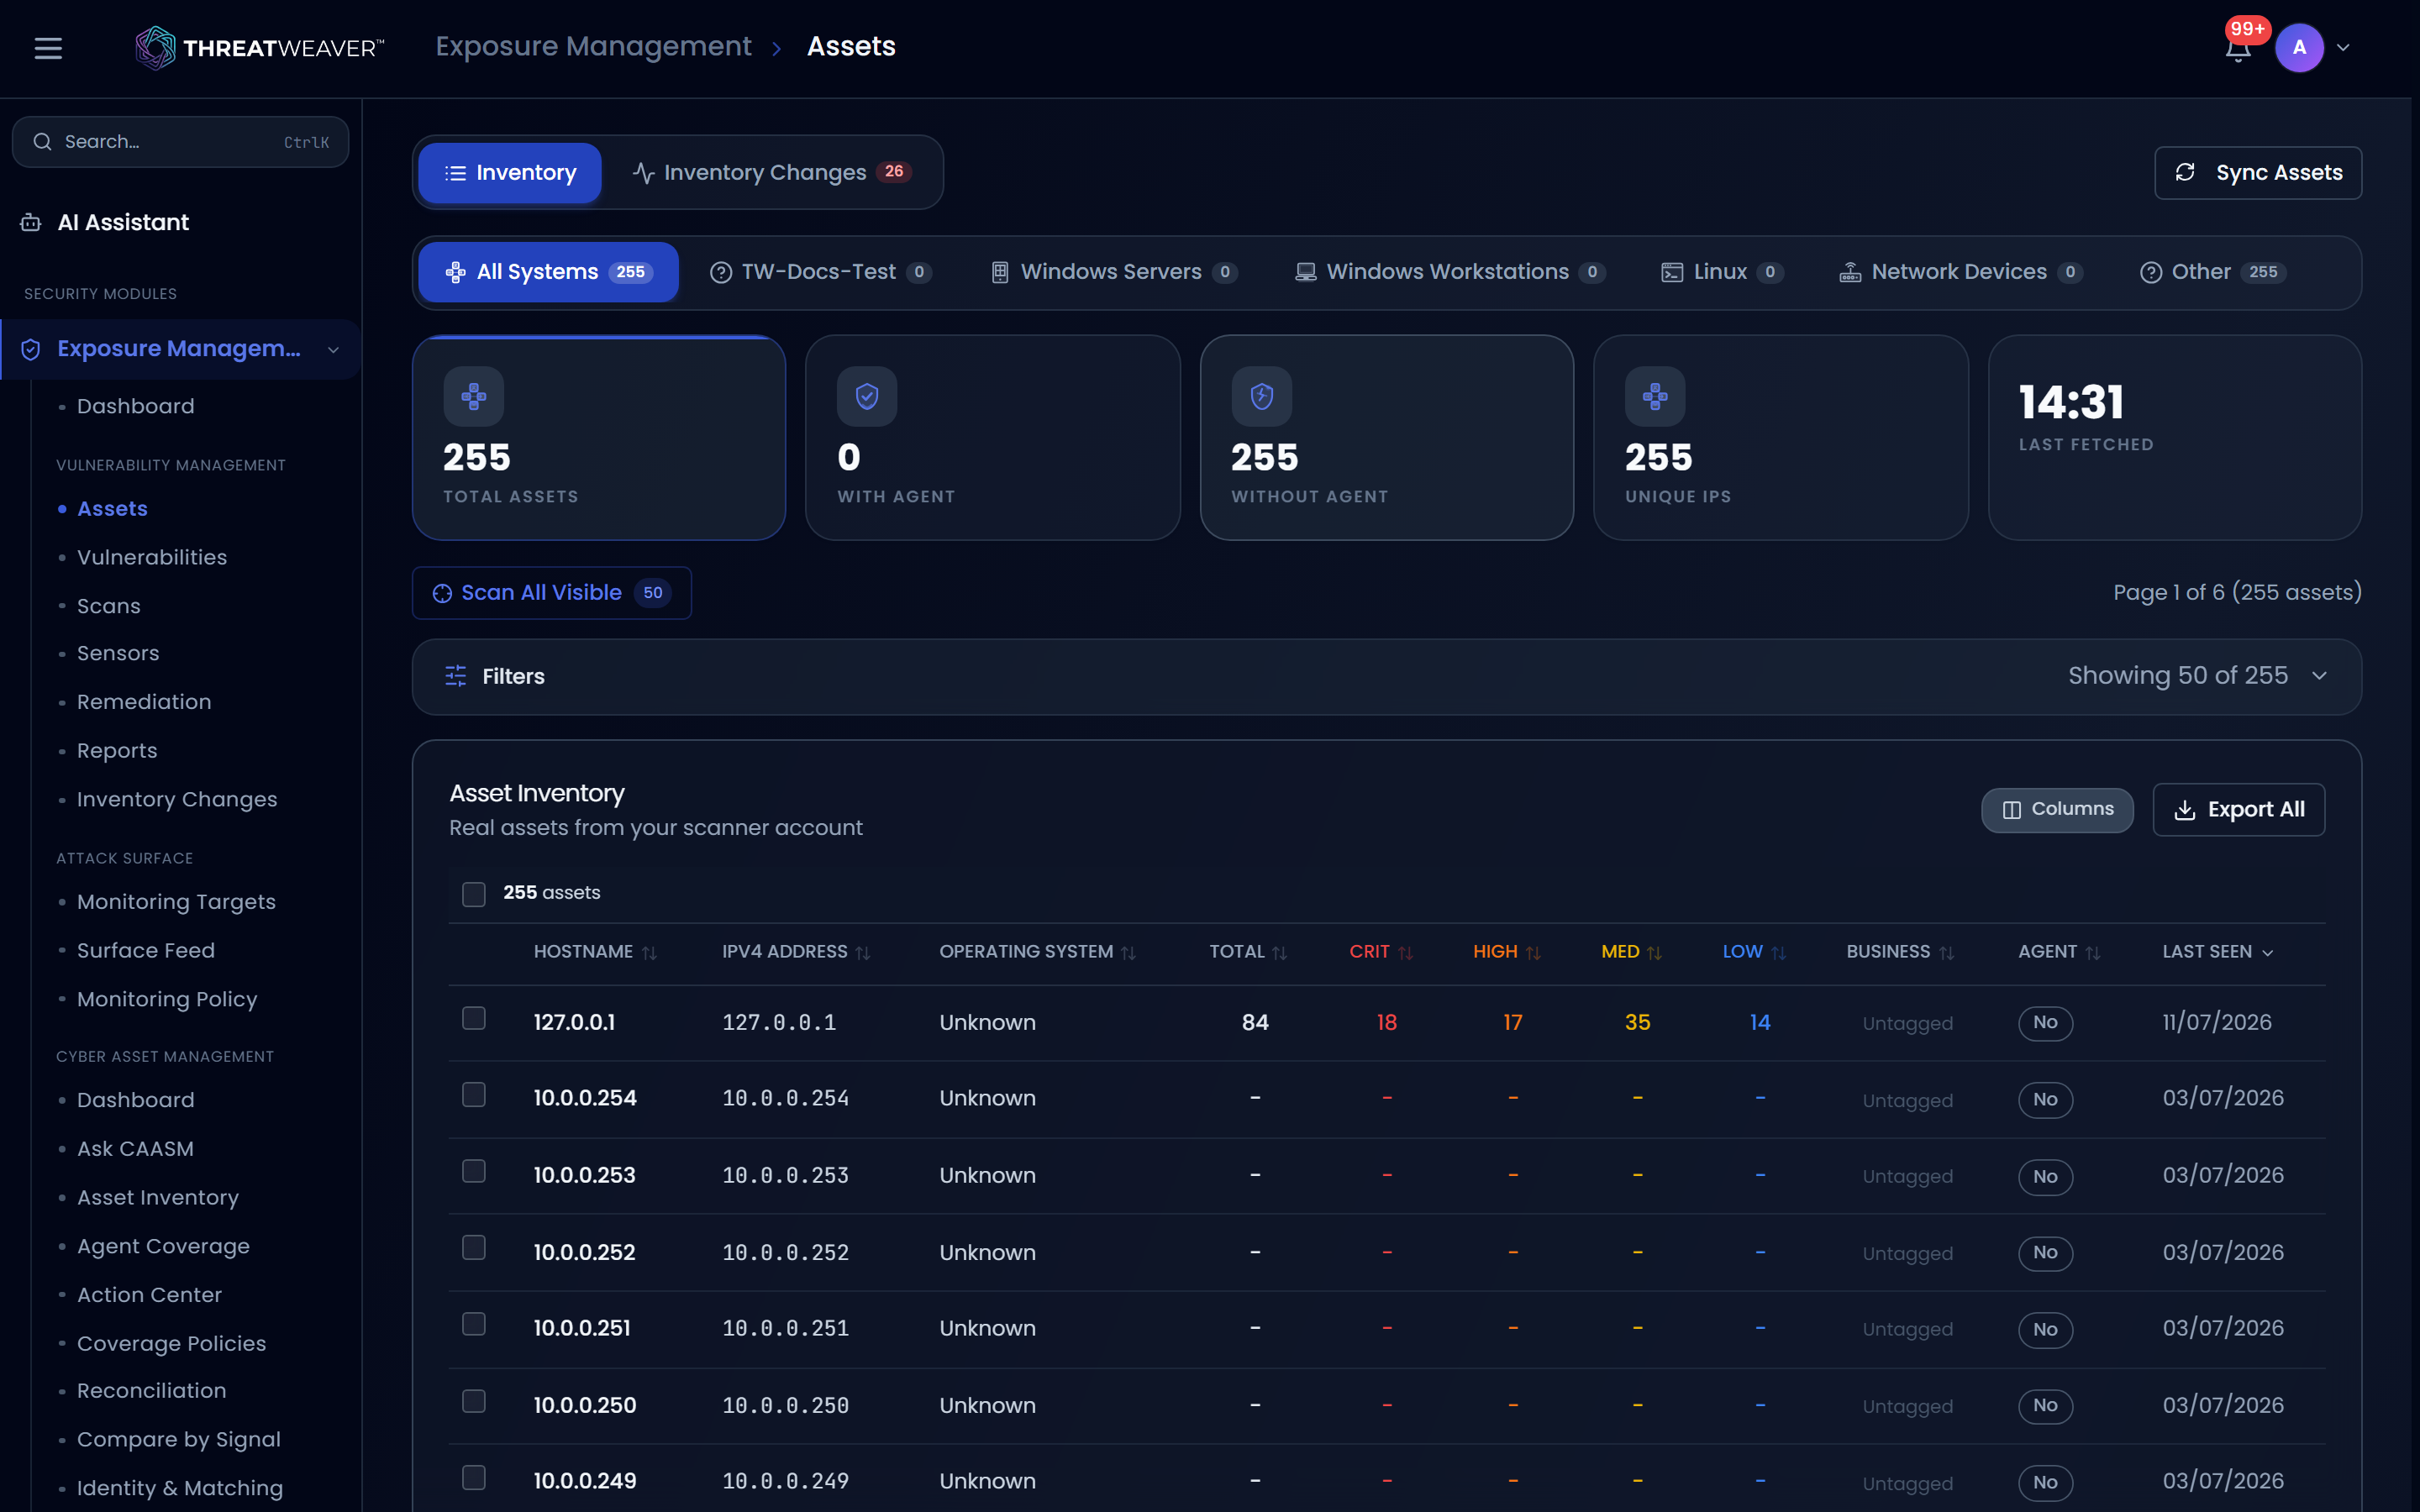
A toggle at the top switches to Inventory Changes, a timeline of inventory drift on these same assets instead of a live snapshot.
Inventory / Inventory Changes toggle
At the very top of the page, Inventory and Inventory Changes switch between the two views. Inventory Changes carries a red count badge when there are open high-or-above-severity changes waiting to be reviewed. A Sync Assets button next to the toggle triggers a fresh pull from your connected scan sources and shows a spinner while it runs.
System-type tabs
A row of tabs (All Systems, Windows Servers, Windows Workstations, Linux, Network Devices, and Other) filters the whole page to one group of systems. Each tab shows a live count.
Summary cards
Below the tabs, five cards summarize the current view:
| Card | What it shows | Clicking it |
|---|---|---|
| Total Assets | Every asset matching your current filters. | Resets the Agent, System-type, and Business-Criticality filters back to "all." |
| With Agent | Assets that have a scan agent installed. | Filters to agent-covered assets; click again to clear. |
| Without Agent | Assets with no agent installed. | Filters to agentless assets; click again to clear. |
| Unique IPs | Distinct IP addresses across the current view. | Not clickable. |
| Last Fetched | The time your asset data was last refreshed. | Not clickable. |
Search and filters
Above the table, a Scan action button and a page indicator sit next to the Filters panel.
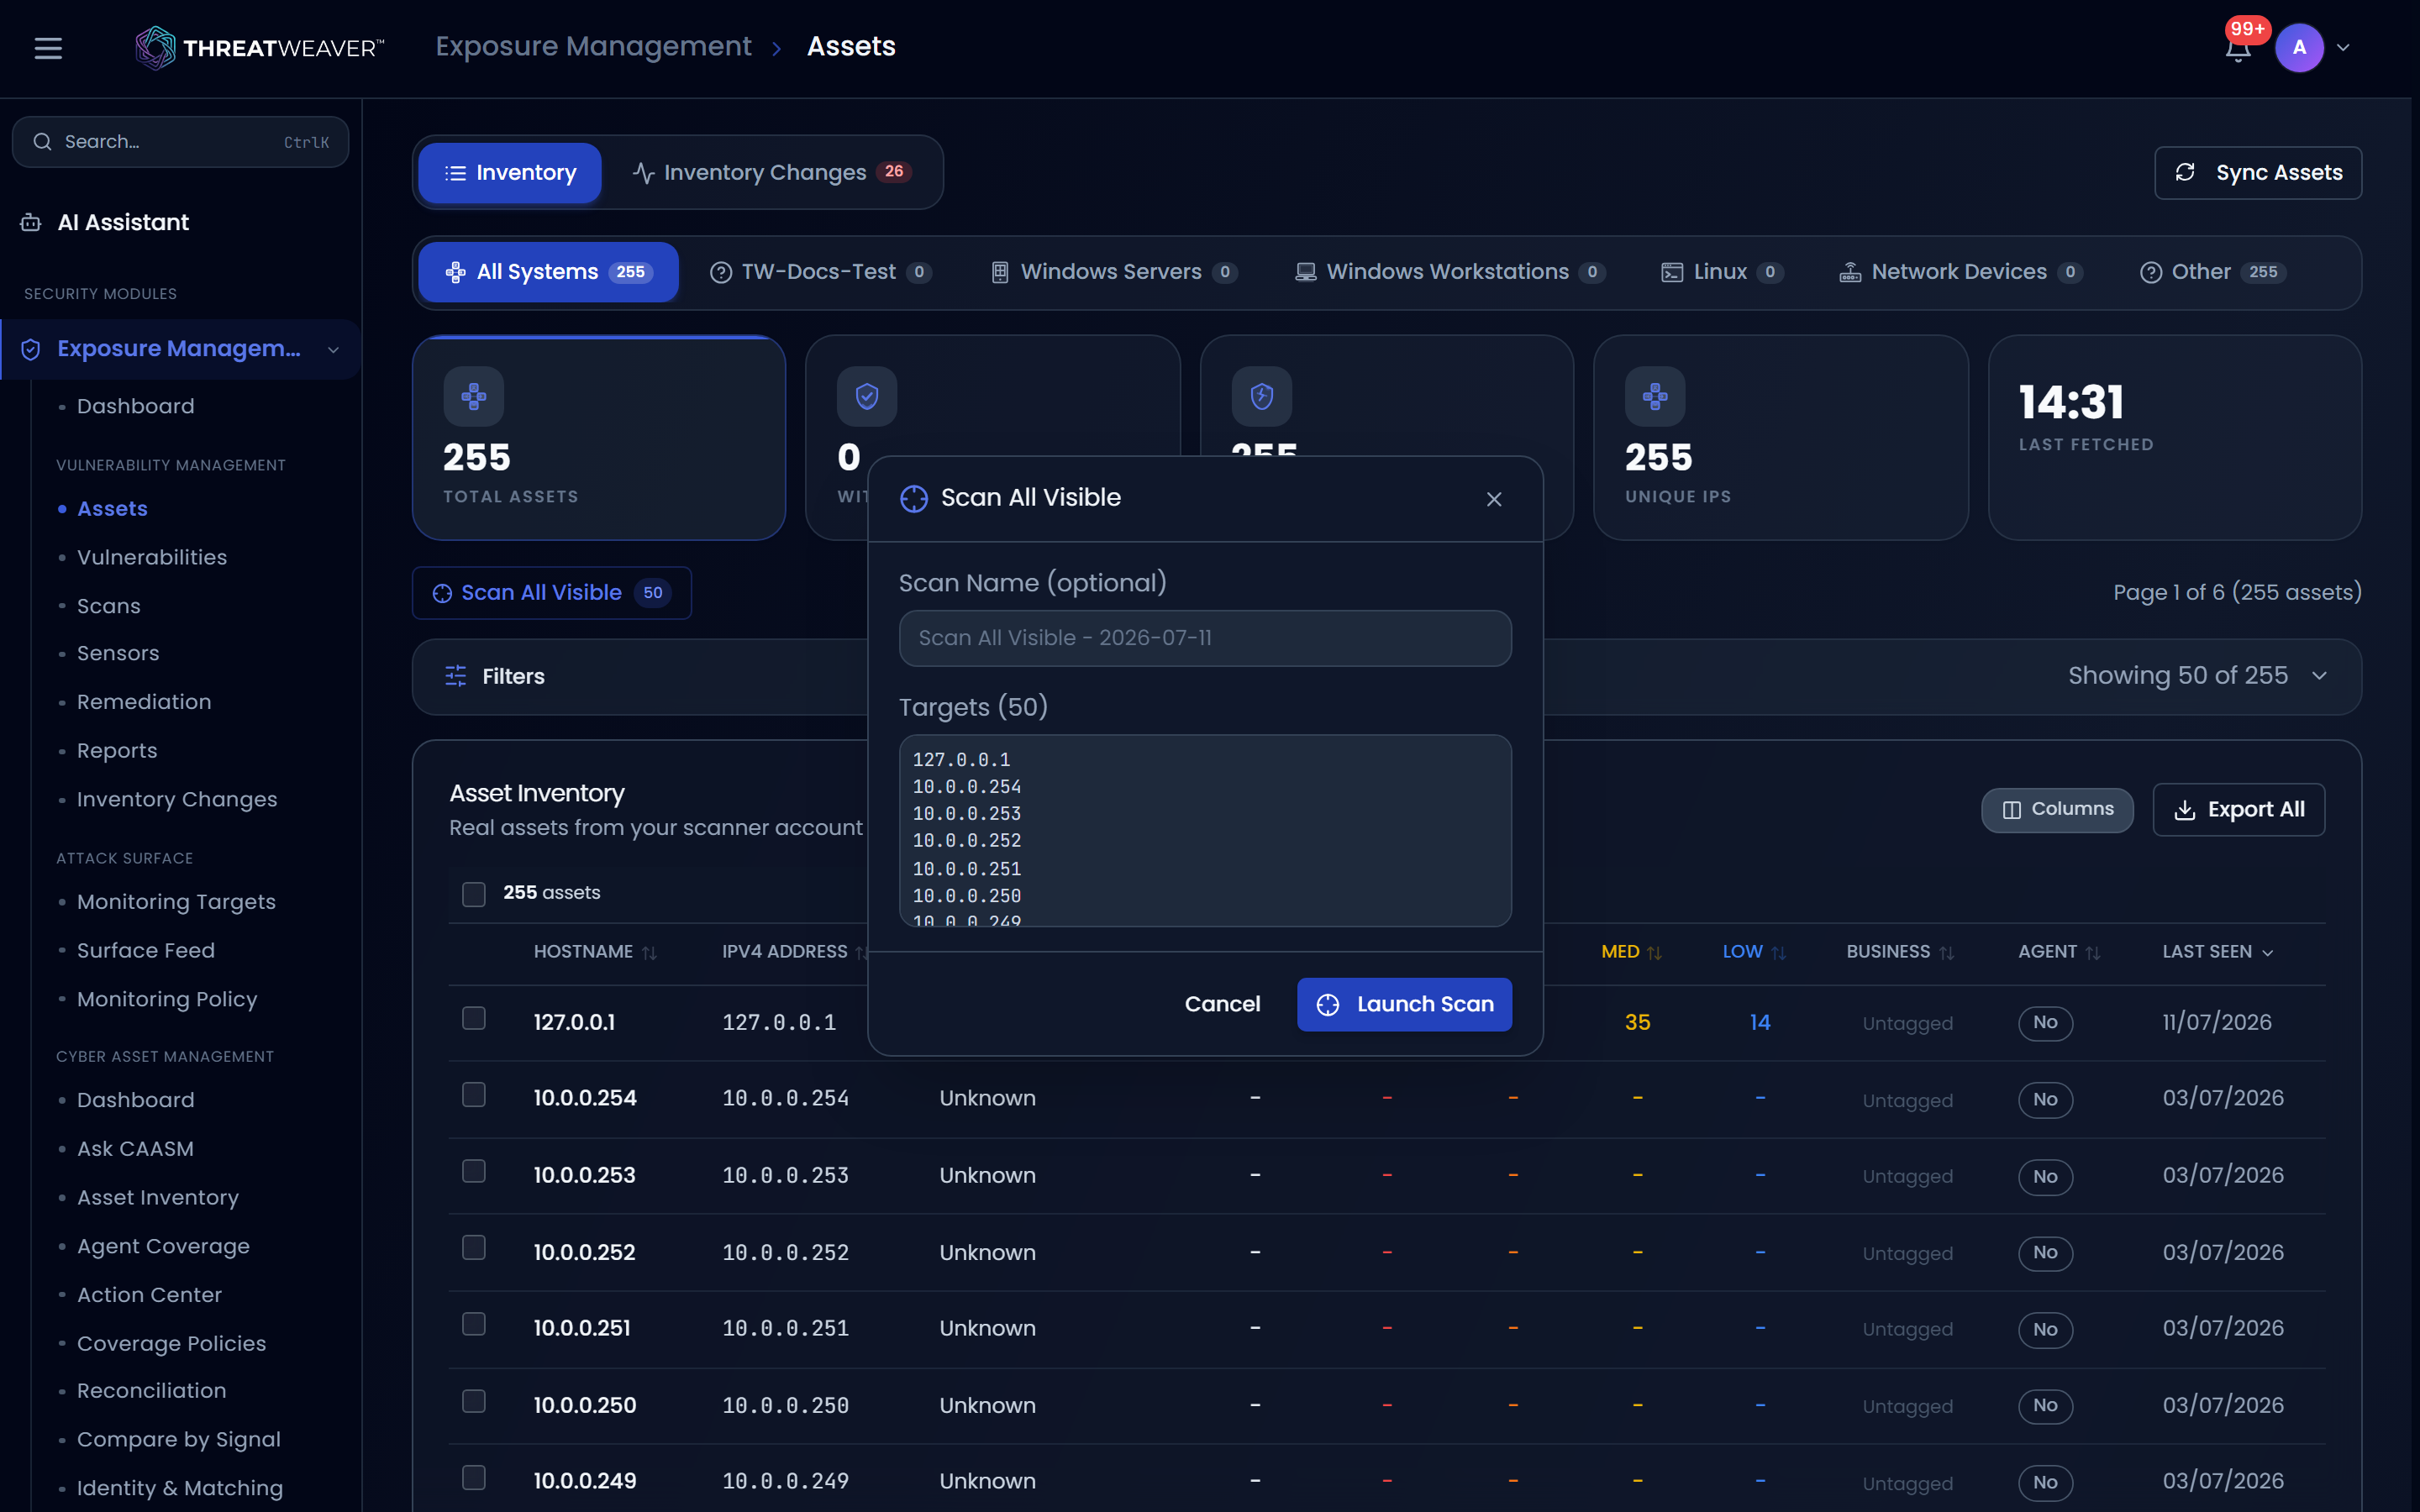
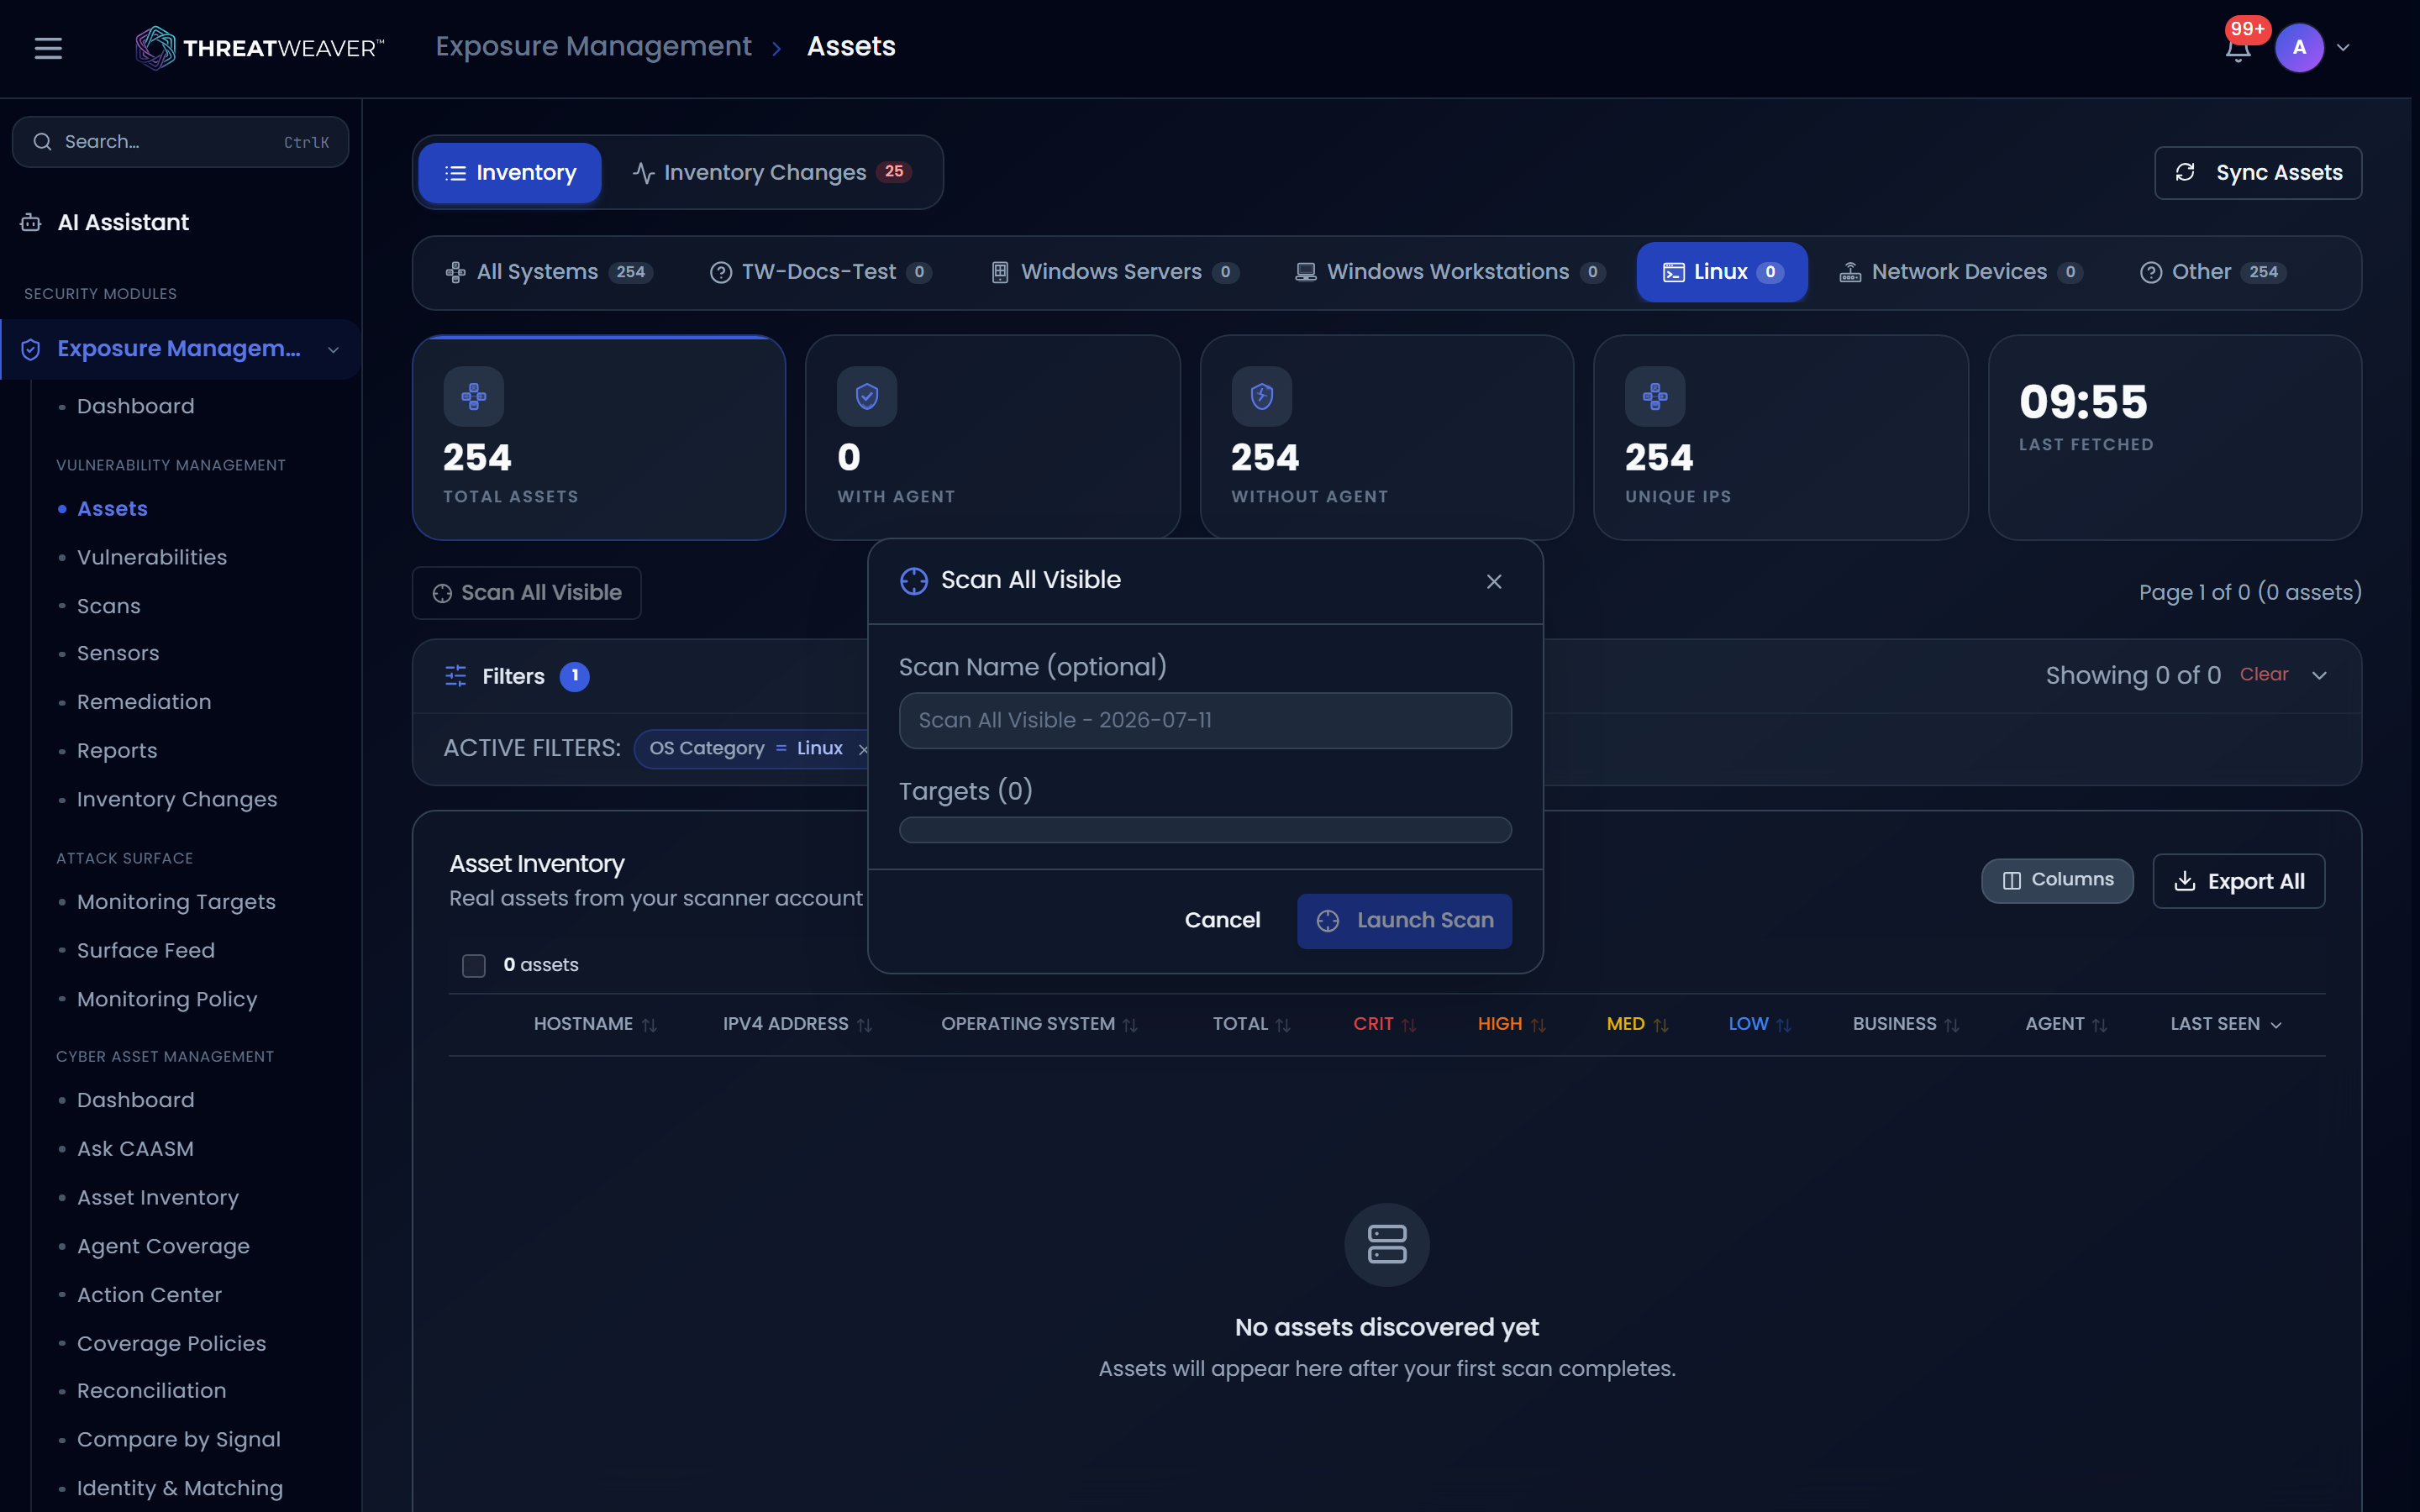
- Scan Selected / Scan All Visible / Scan All N: launches a quick scan against your current selection (or every visible asset if nothing is selected). See Launching a scan from a selection.
Click Filters to expand the panel. It shows how many filters are active and Showing N of M assets, with Quick Filters and Advanced Query Builder modes plus Saved filters, the same pattern used on the Vulnerabilities list.
Quick Filters
| Filter | What it narrows to |
|---|---|
| Agent | Assets With Agent or Without Agent. |
| Licensed | Assets that are or aren't licensed for scanning. |
| OS Category | The same system-type groups as the tabs above. |
| OS Name | A specific operating-system name. |
| Business Criticality | Assets tagged at a given criticality level, or untagged. |
| Severity | Assets that have at least one finding at the chosen severity. |
| Last Seen | A rolling window (7 / 30 / 90 days) or a custom date range. |
| Search | A keyword match across the asset's identifiers. |
After changing quick filters, click Apply Filters to run them; an Unapplied changes note appears until you do. Clear Filters resets everything.
Advanced Query Builder
Switch to Advanced Query Builder to build precise conditions field by field (a field, an operator, and a value) combined with AND/OR and nested into groups. Quick Filters and the Advanced Query Builder are mutually exclusive: applying one clears the other.
Saved filters
Use Saved filters to store a filter combination you return to often, then reload it in one click. Save it into a folder to keep related filters together, rename it inline, or mark one as your default so it applies automatically next time you open this page.
Choosing which sources to show
When your workspace has more than one scan source connected, a Sources toggle lets you view Combined results, a single source only, or Overlapping only (assets more than one source reports). Source badges on each row show which scanner or scanners saw that asset.
The Asset Inventory table
The table header names the current view and shows whether you're looking at real or demo data. Its controls sit on the right:
| Control | What it does |
|---|---|
| Columns | Choose which columns are visible; reset to the defaults. |
| Export mode | (Multiple sources only.) Deduped export merges the same asset seen by more than one source; Raw per-source export keeps one row per source. |
| Export | Opens the export builder for your current selection (or all matching assets if nothing is selected). |
Columns
Depending on your column selection, the table can show: Hostname, IPv4 Address, IPv6, FQDN, NetBIOS Name, MAC Addresses, Operating System, System Type, vulnerability counts (Total, Critical, High, Medium, Low), ACR Score and AES Score (Asset Criticality Rating and Asset Exposure Score, if your scan source provides them), Business Context (the criticality tag and its scoring multiplier) and Adjusted ACR (the ACR score after that multiplier is applied), Agent and Agent Name, Licensed, Sources, Last Seen, and First Observed, plus any extra scan-source fields you enable. Click a sortable column header to sort by it; click again to reverse the order.
Selecting assets and tagging business context
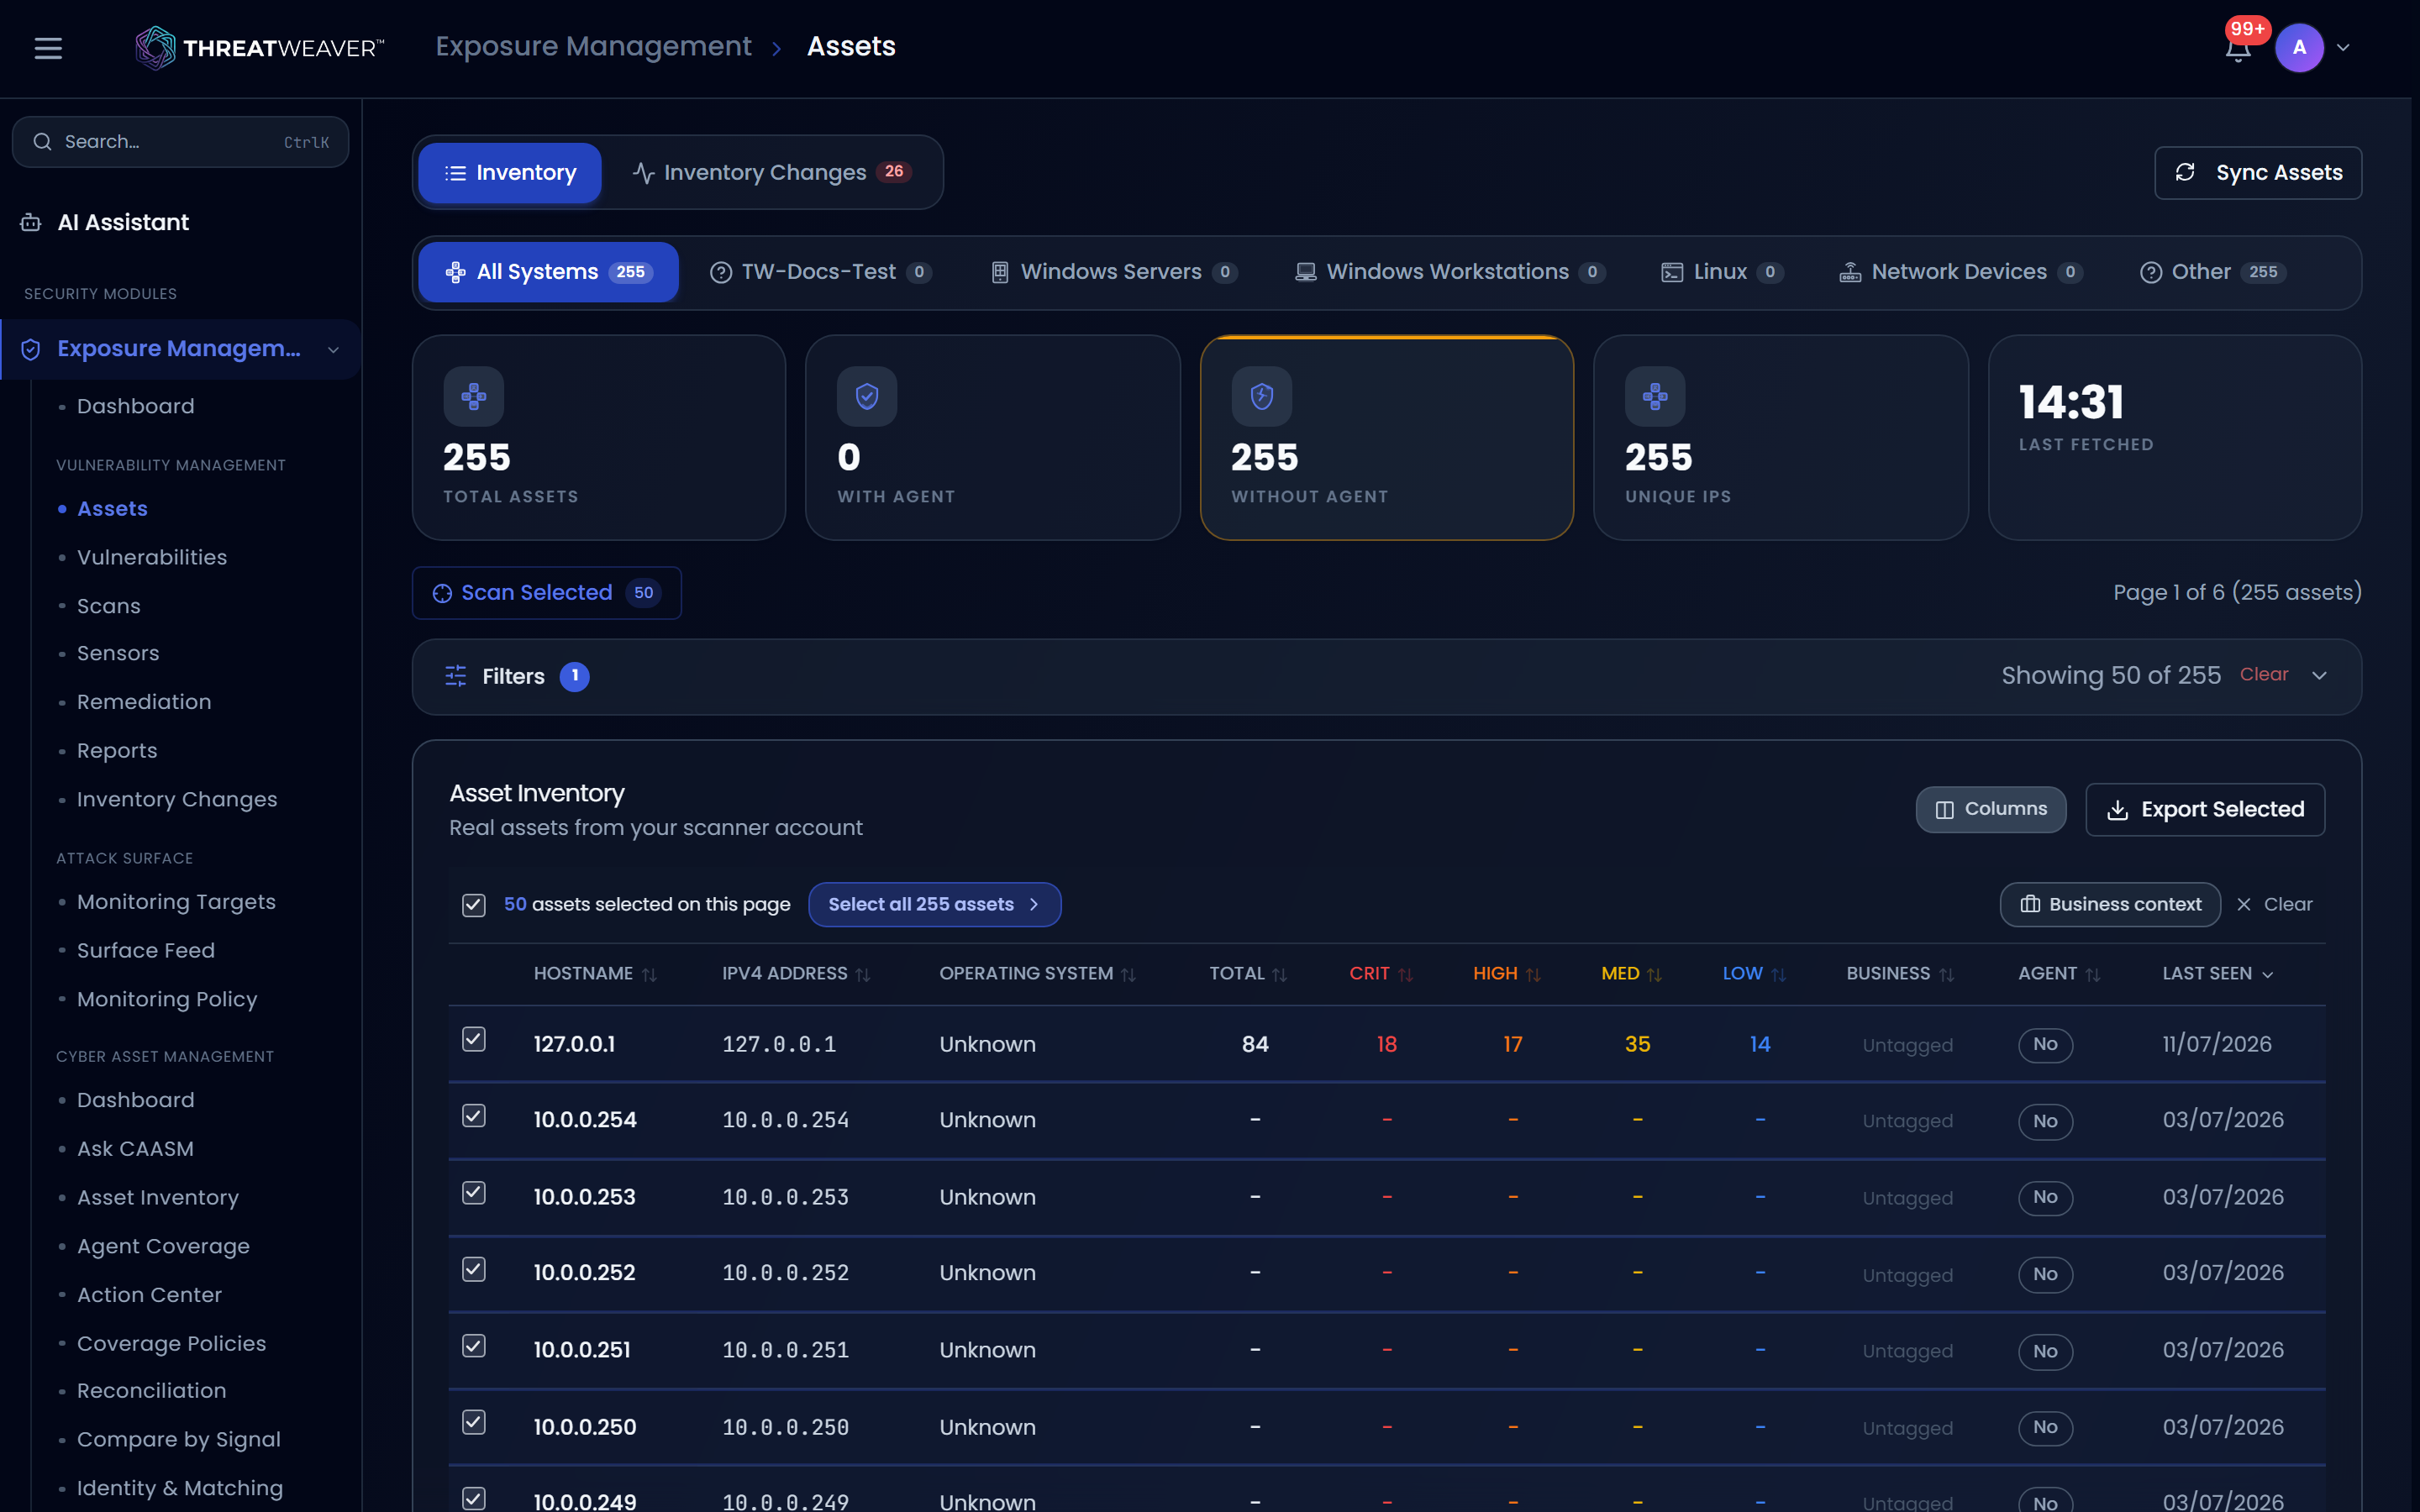
A selection bar sits above the table with a checkbox that selects every asset on the current page; if more assets match your filters, a Select all N assets link extends the selection to the full filtered set. With a selection active:
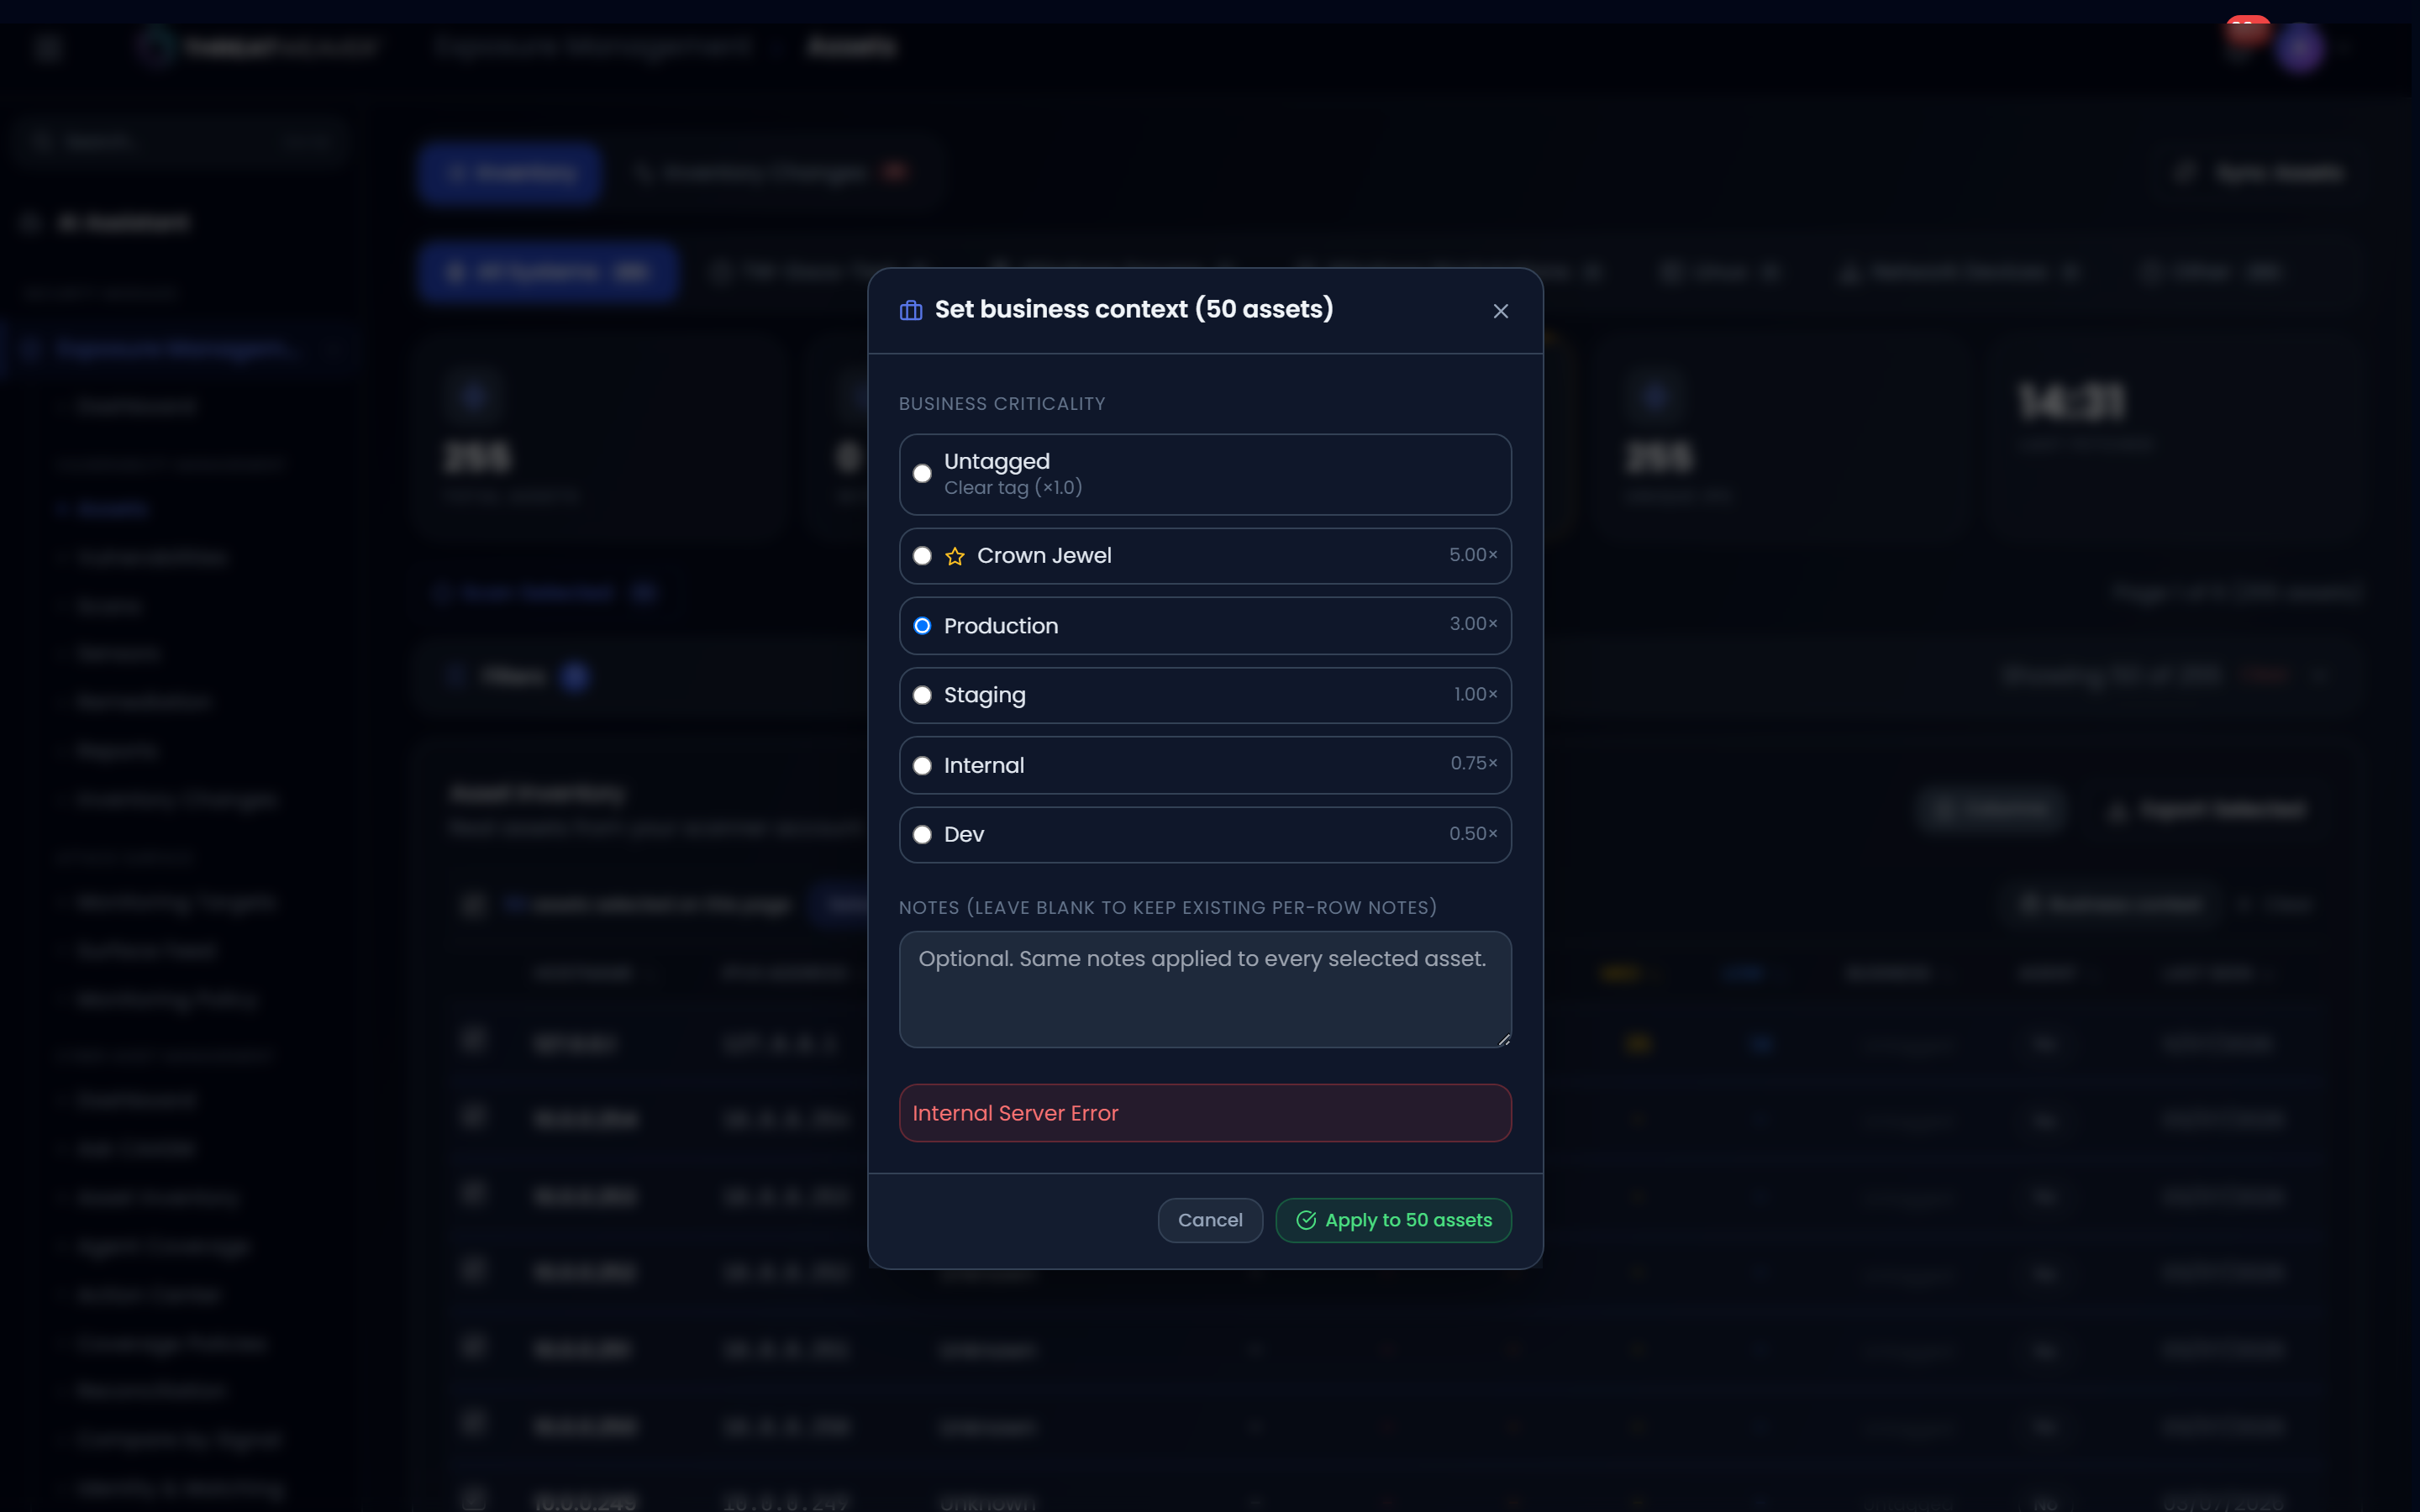
- Business context opens a panel to set a business-criticality level (Crown Jewel, Production, Staging, Internal, or Dev) on every selected asset at once, with an optional note. Each level carries a scoring multiplier that's applied to the asset's risk score, shown next to the level.
- Clear drops the selection.
A confirmation banner reports how many assets were updated after a bulk tag.
Reading the rows
Click any row to open the asset detail panel. If nothing matches your filters, the table says so and suggests adjusting or clearing them.
The asset detail panel
Clicking a row opens a side panel with a vulnerability summary for that asset and six tabs:
- Overview: the asset's identifiers and core details.
- Ownership: who or what team the asset is associated with.
- Business Context: its criticality tag, scoring multiplier, and notes.
- Software / SBOM: installed software detected on the asset.
- Vulnerabilities: the findings open on this asset, in a table you can scan without leaving the panel.
- Monitoring: continuous-monitoring status for the asset.
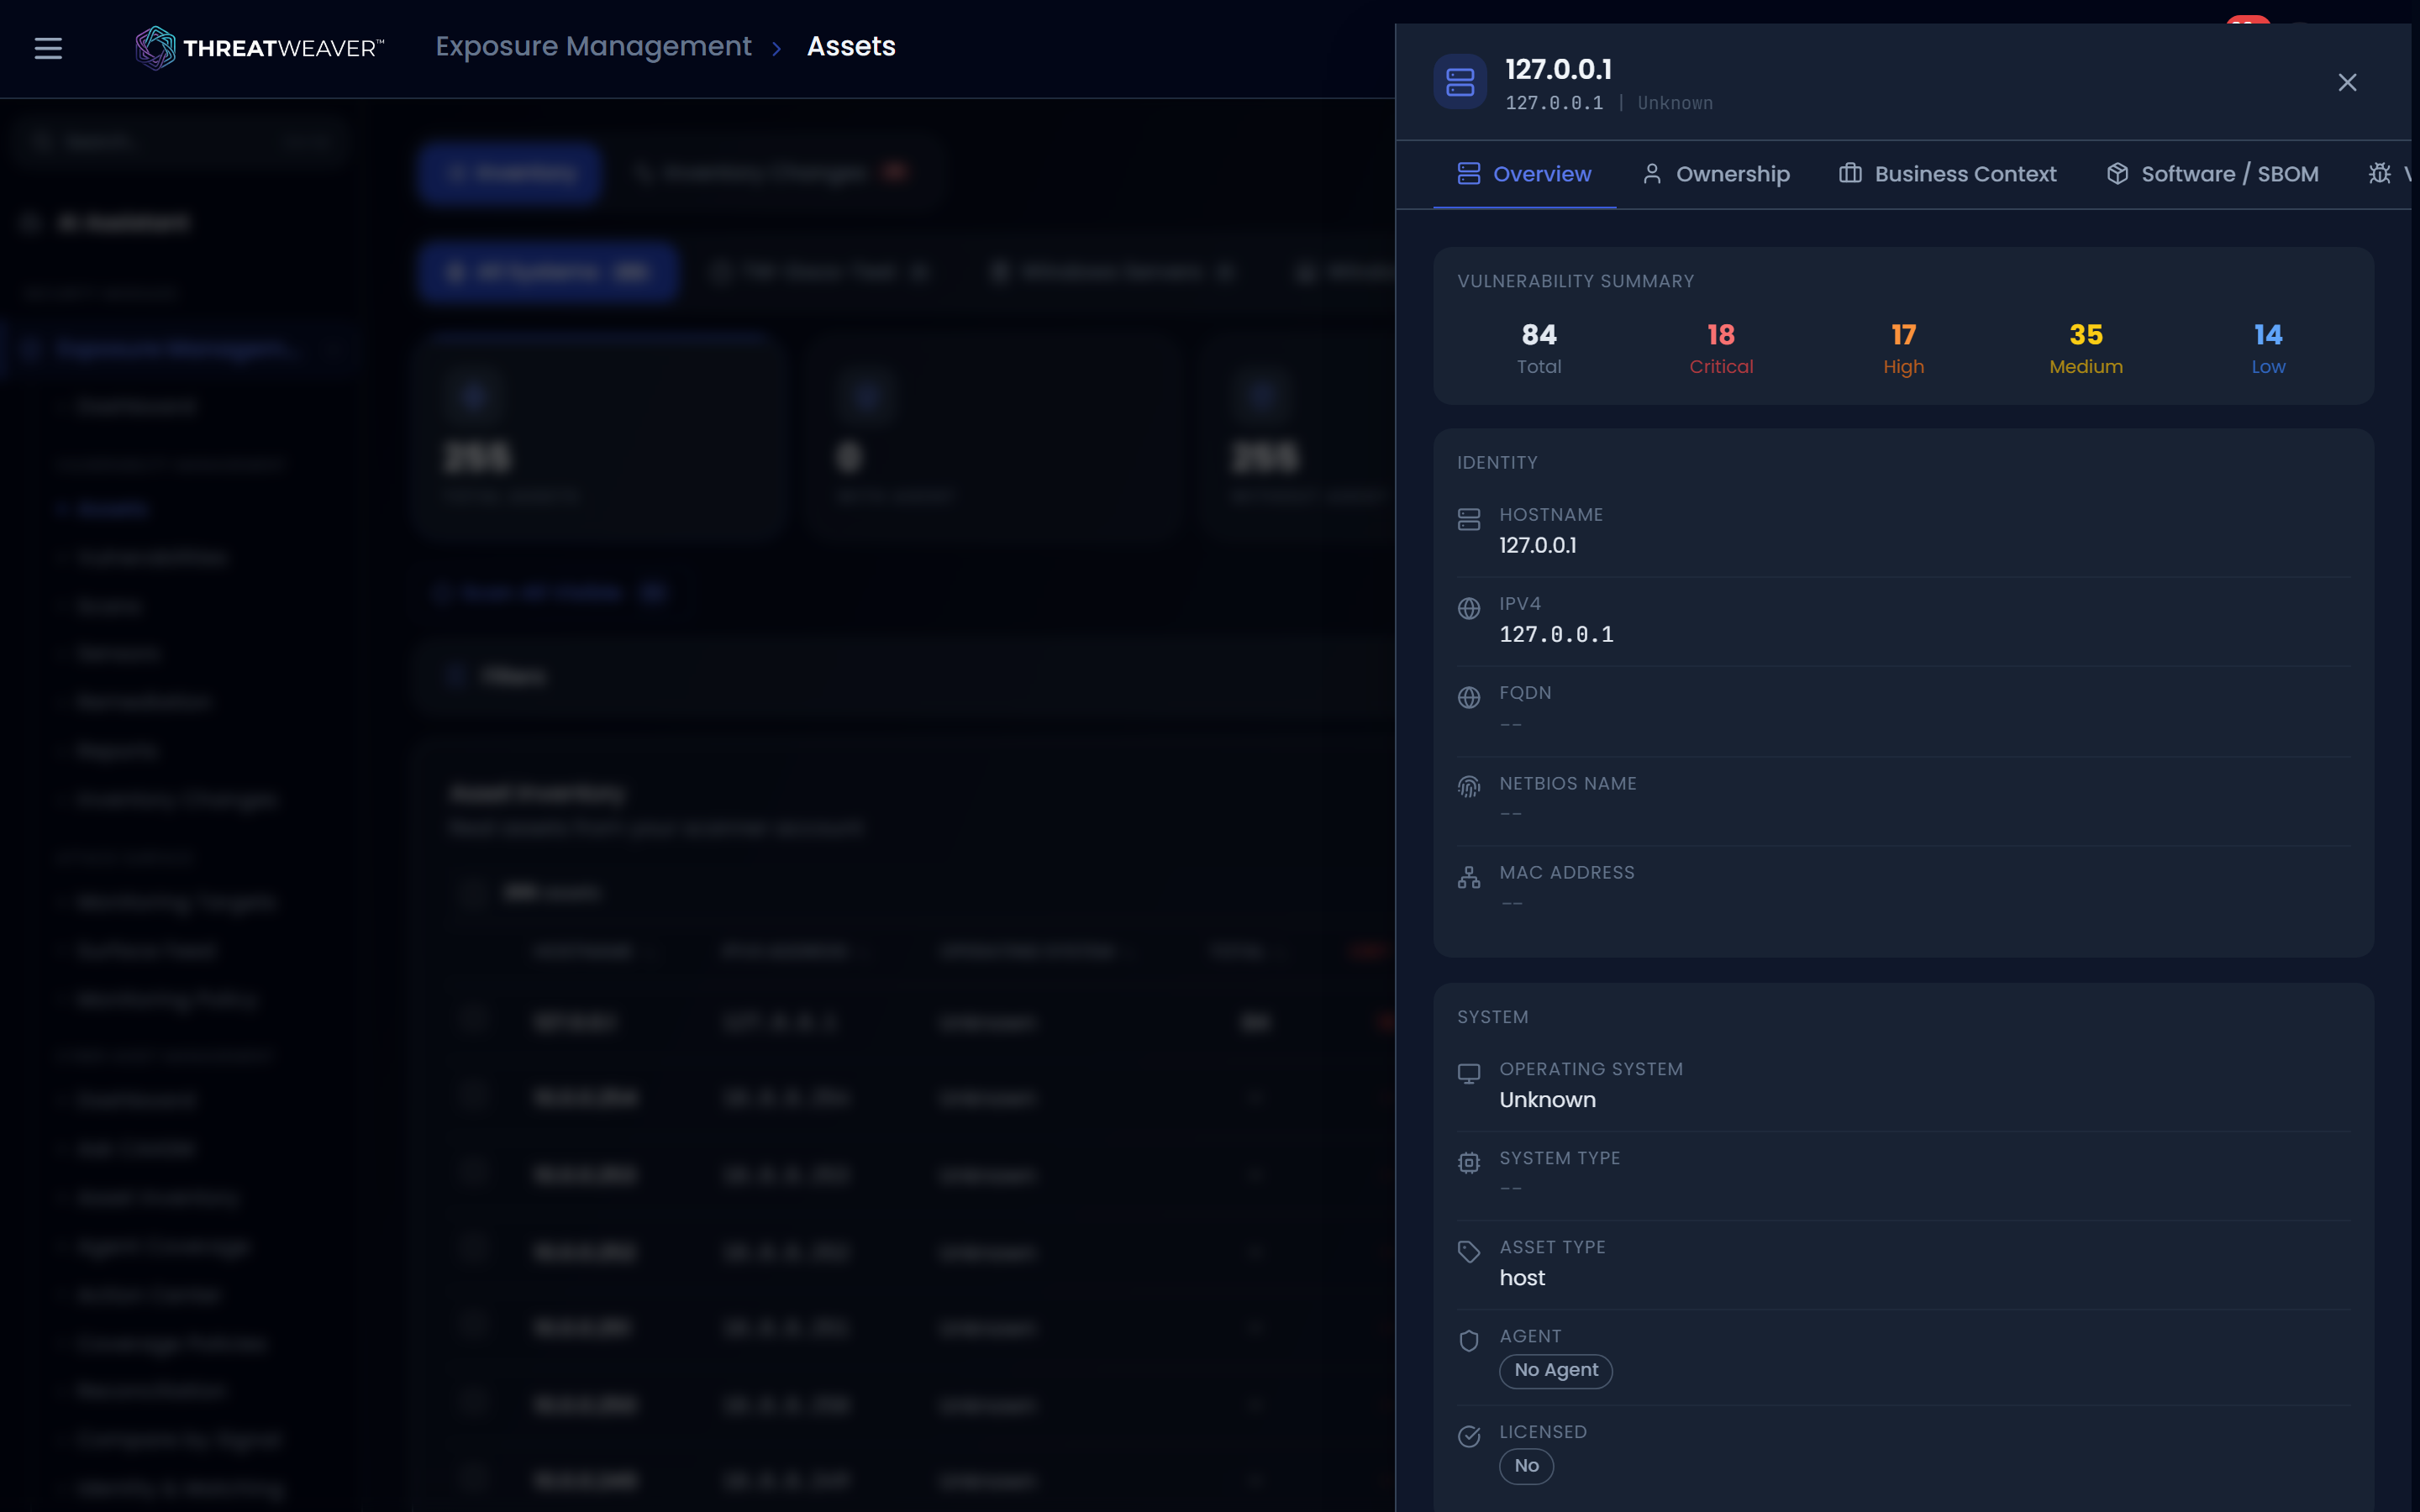
Close the panel to return to the list.
Launching a scan from a selection
Click Scan Selected, Scan All Visible, or Scan All N to open the quick-scan dialog. Name the scan (or leave the default), review the target list, and click Launch Scan to queue it immediately.
Exporting the list
Click Export to open the export builder, which carries your current selection or filters into a named export. When more than one scan source is active, choose Deduped export or Raw per-source export first to control how assets seen by multiple sources are handled.
Inventory Changes
Switch to Inventory Changes to see drift on this same asset population over time (assets added or removed, and changes to their services, open ports, or TLS certificates) rather than a point-in-time snapshot. This view covers your scanned inventory; unauthenticated, internet-facing discovery events from verified monitoring targets live in Attack Surface instead.
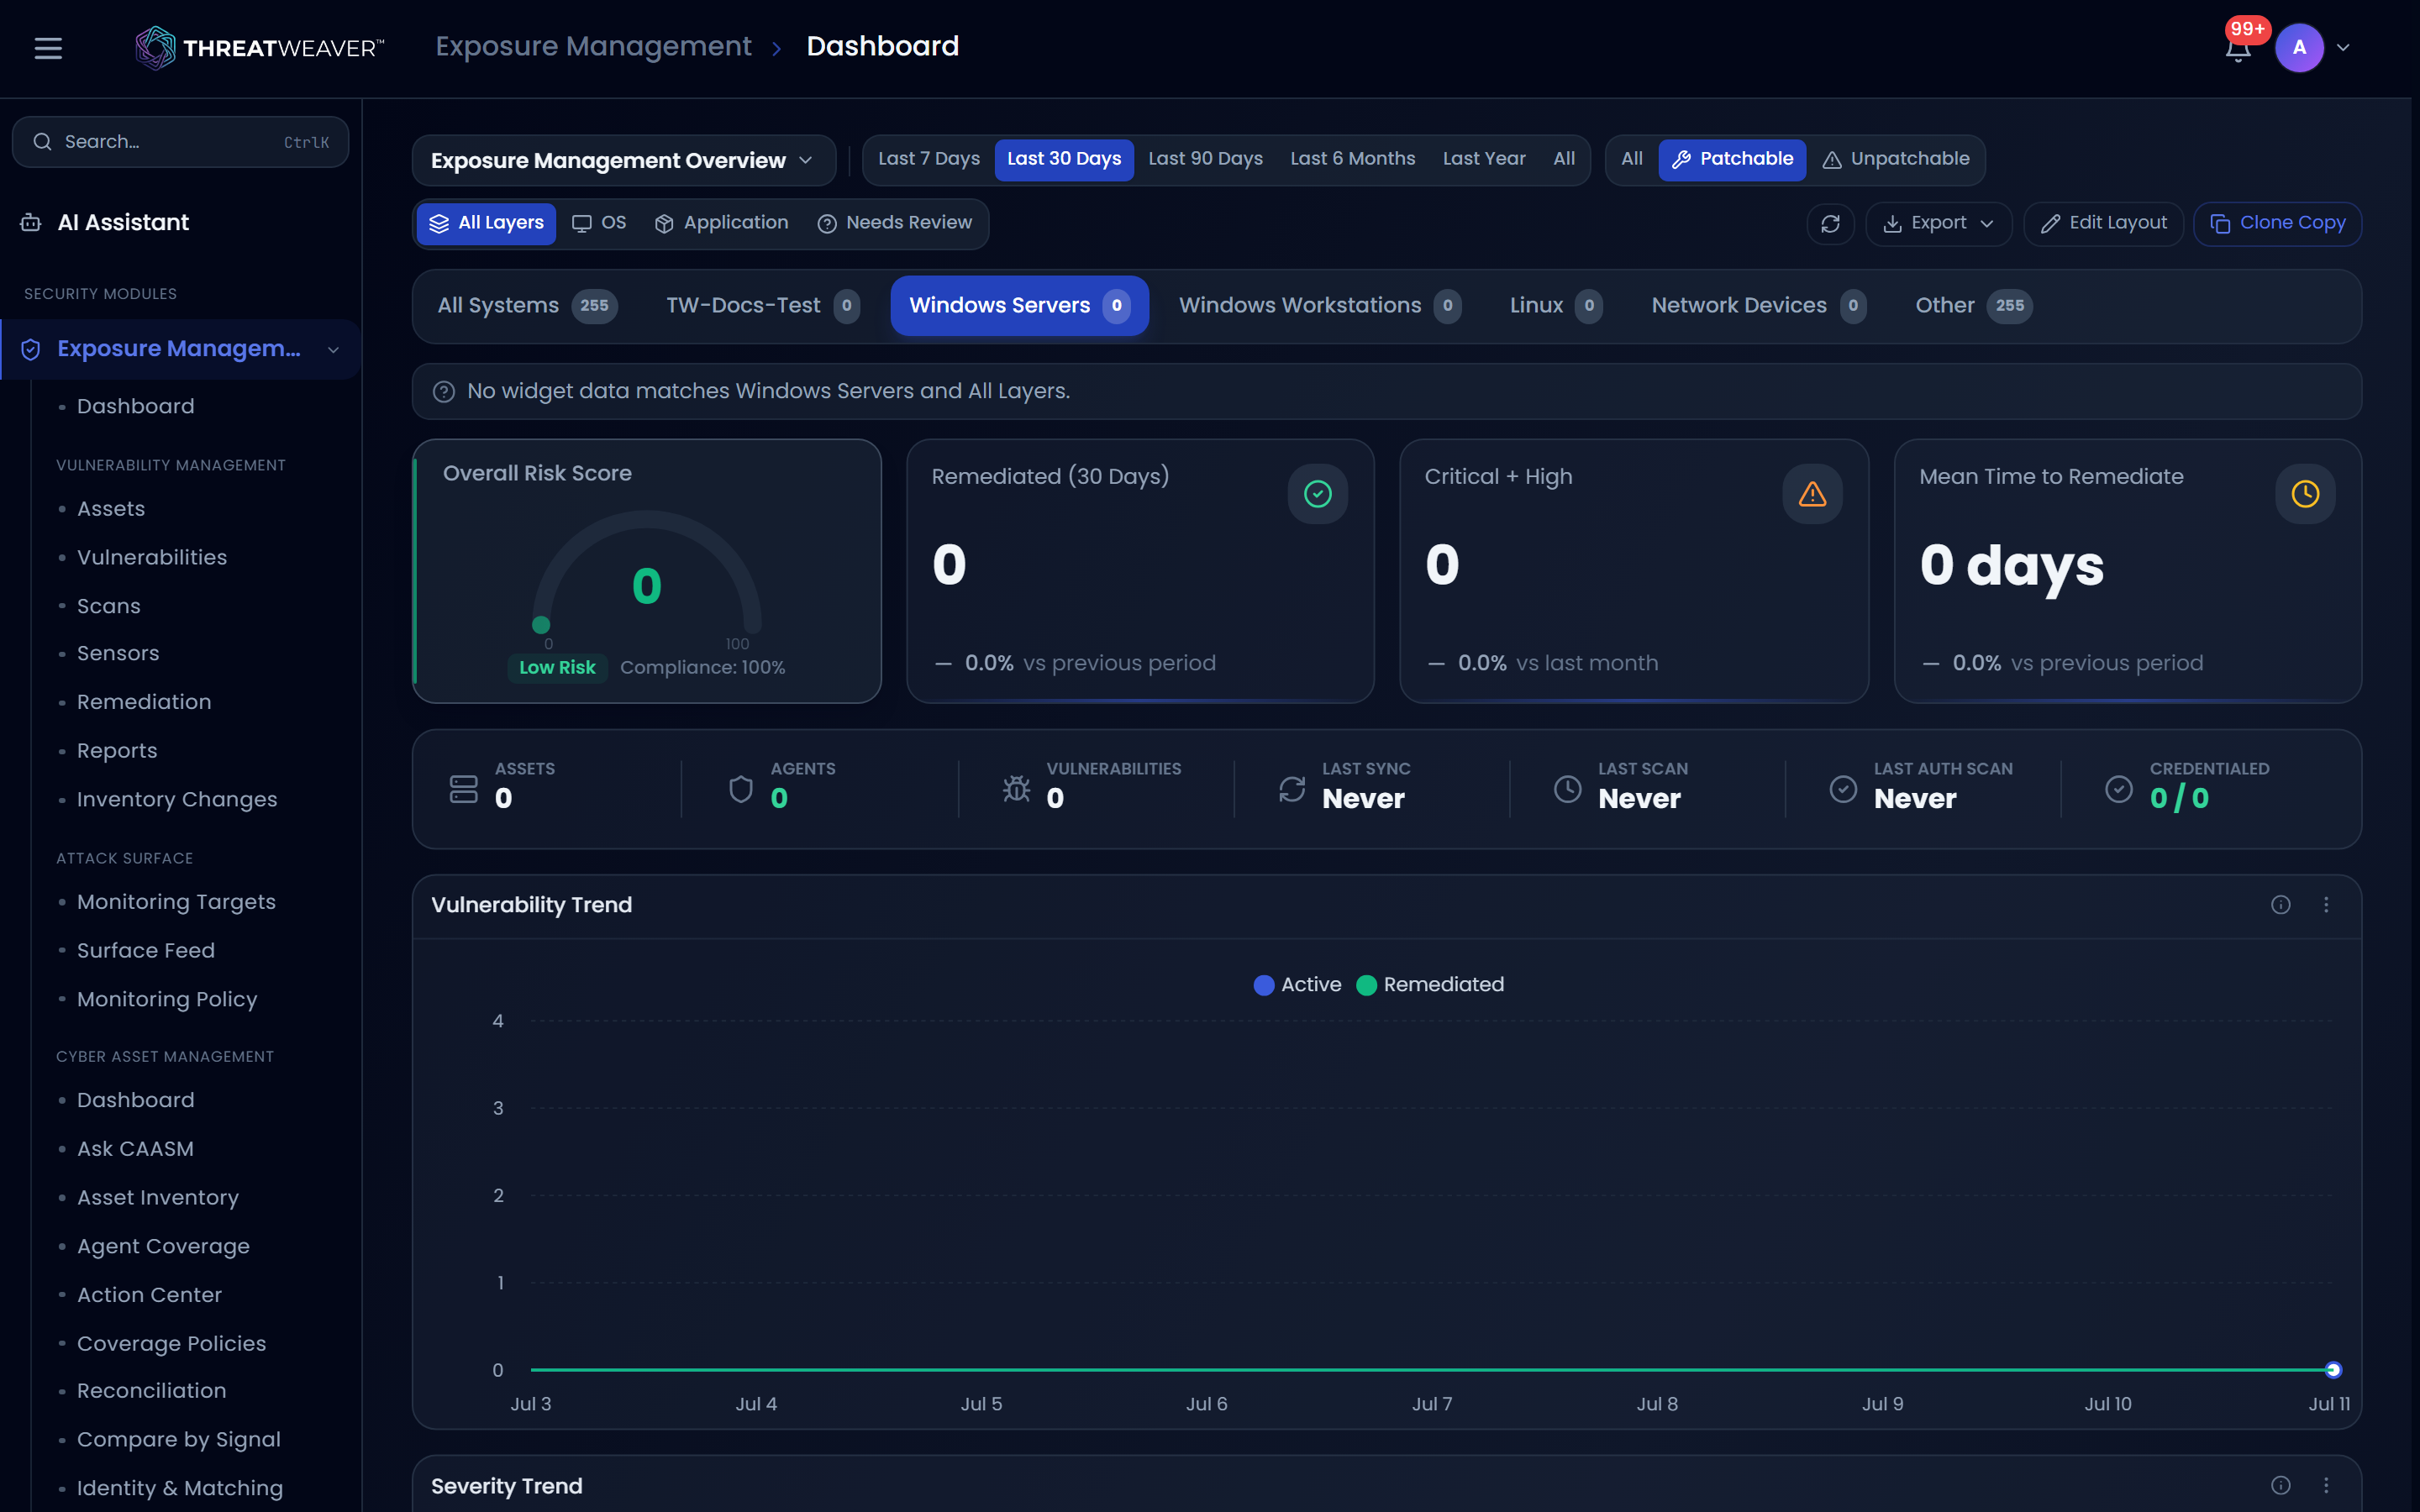
Four cards summarize the picture: Monitored Assets, Due Now (assets due for a fresh check), Open High+ Changes, and Last Run. Below them:
| Control | What it does |
|---|---|
| Severity | Filters the timeline to All, High, Medium, or Low severity changes. |
| Type | Filters to a specific kind of change: new or removed asset, new or removed service, port opened or closed, TLS certificate change or expiry, software version change, banner change, OS change, or DNS record change. |
| Refresh | Re-runs the change query. |
Each entry in the timeline shows its severity, its type, when it was detected, a short title and summary, and the asset or host it affects. If inventory monitoring isn't enabled yet, or nothing has changed, the timeline explains why instead of showing an empty table. Use the pager at the bottom to move through more events.
Common workflows
Workflow: find agentless production assets and tag them
- Click the Without Agent summary card to filter to assets with no agent installed.
- Select the assets that belong to production (using the checkbox column, or Select all N assets if every result applies).
- Click Business context, choose Production, and confirm. The assets now carry that criticality tag and its scoring multiplier.
Workflow: scan a filtered set of assets
- Filter the list to the assets you want, for example the Linux system-type tab plus a Last Seen filter for the last 30 days.
- Leave the selection empty to target every visible asset, or select specific rows.
- Click Scan All Visible (or Scan Selected), review the target list in the dialog, and click Launch Scan.
Workflow: review recent inventory drift
- Switch to Inventory Changes.
- Set Severity to High to focus on the changes that matter most.
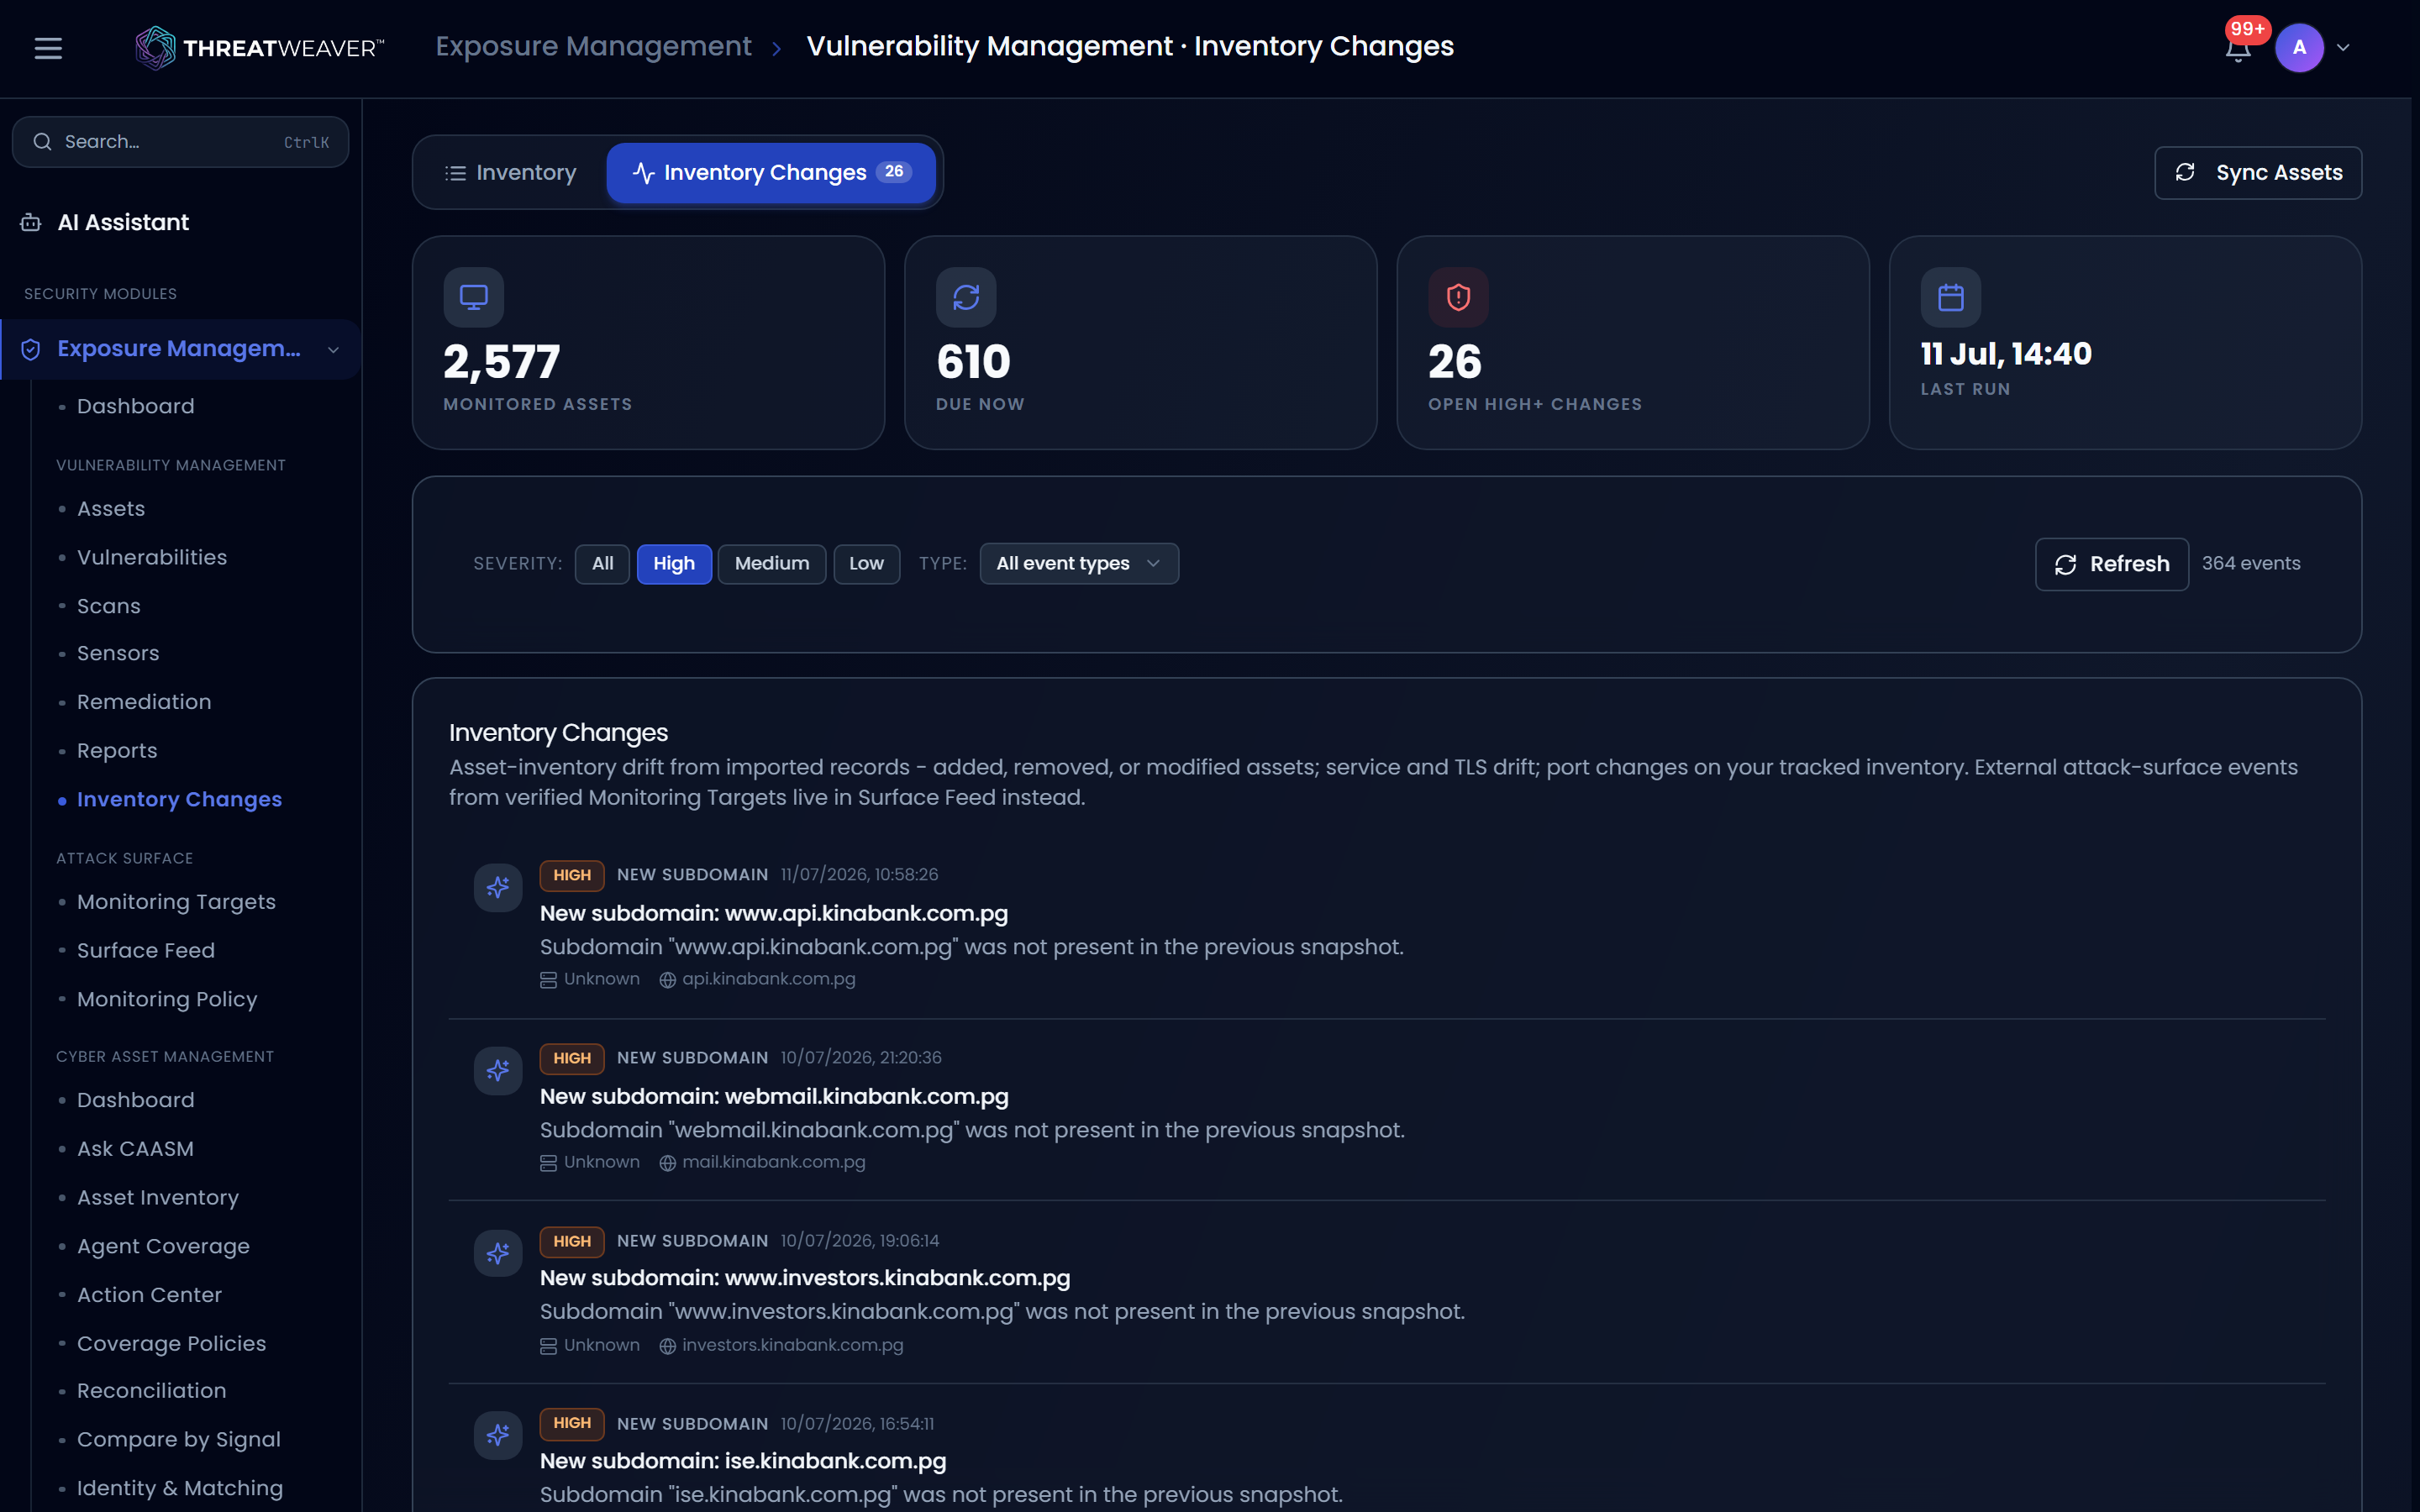
- Read each entry's summary and asset tag to see what changed and where. Click Refresh to pull the latest events.